Bitcoin Price Analysis: The Calm Before The Storm? BTC’s Trying To Maintain The Crucial Support Line
Over the past two days, we had seen the price of Bitcoin trading mainly under a very tight range between $8600 and $8700.
As a reminder of the recent price action, Bitcoin had gone through a decent rally since starting the new decade.
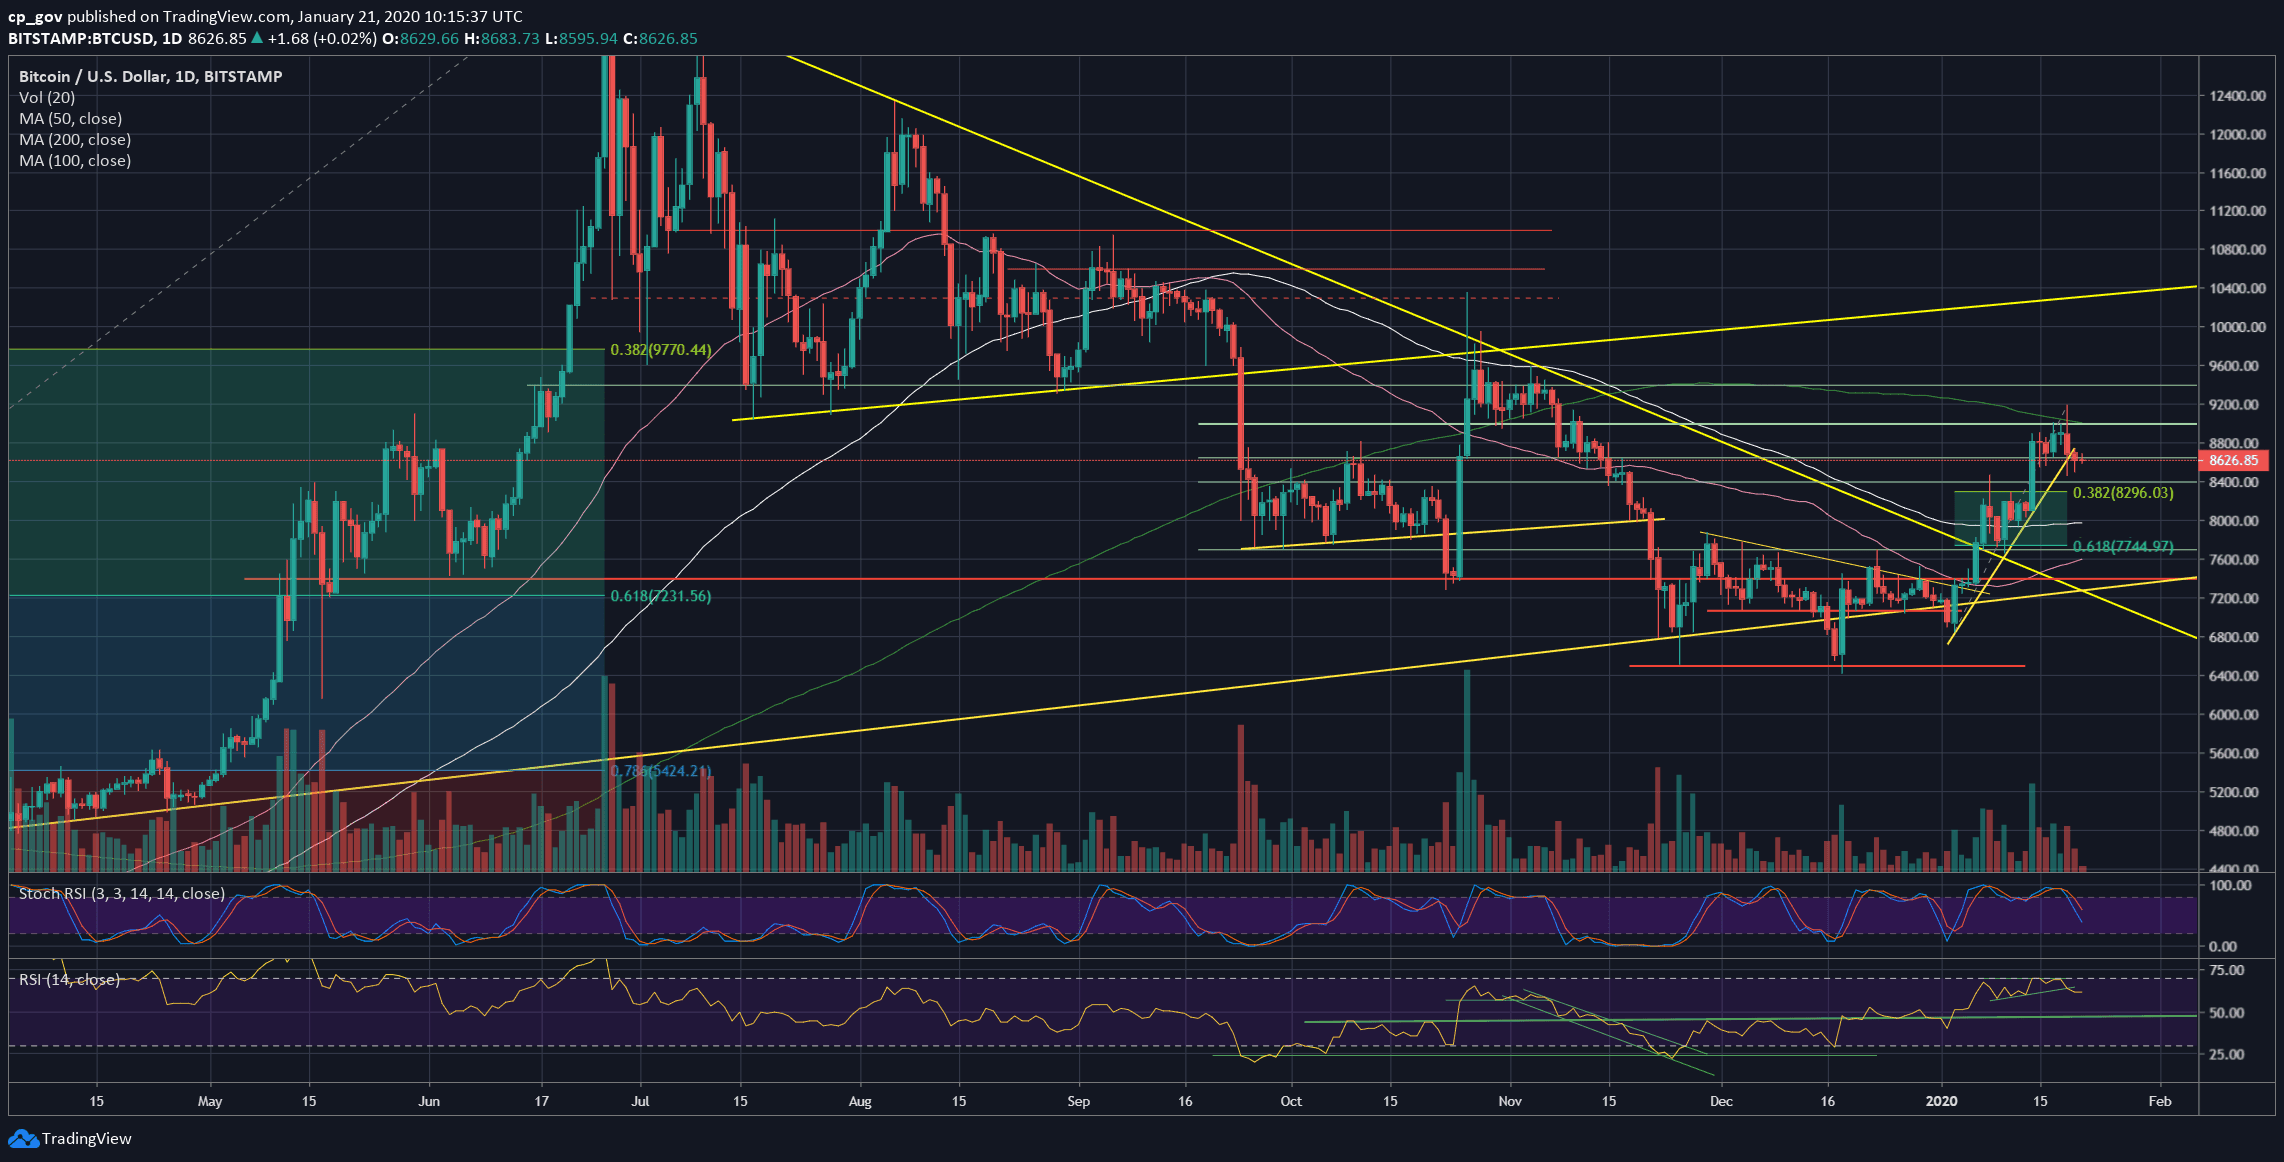
However, right after touching the significant 200-days moving average line (marked light green on the following daily chart), Bitcoin got rejected, plunged more than $700 intraday, and trading safely around the $8600 mark since then.
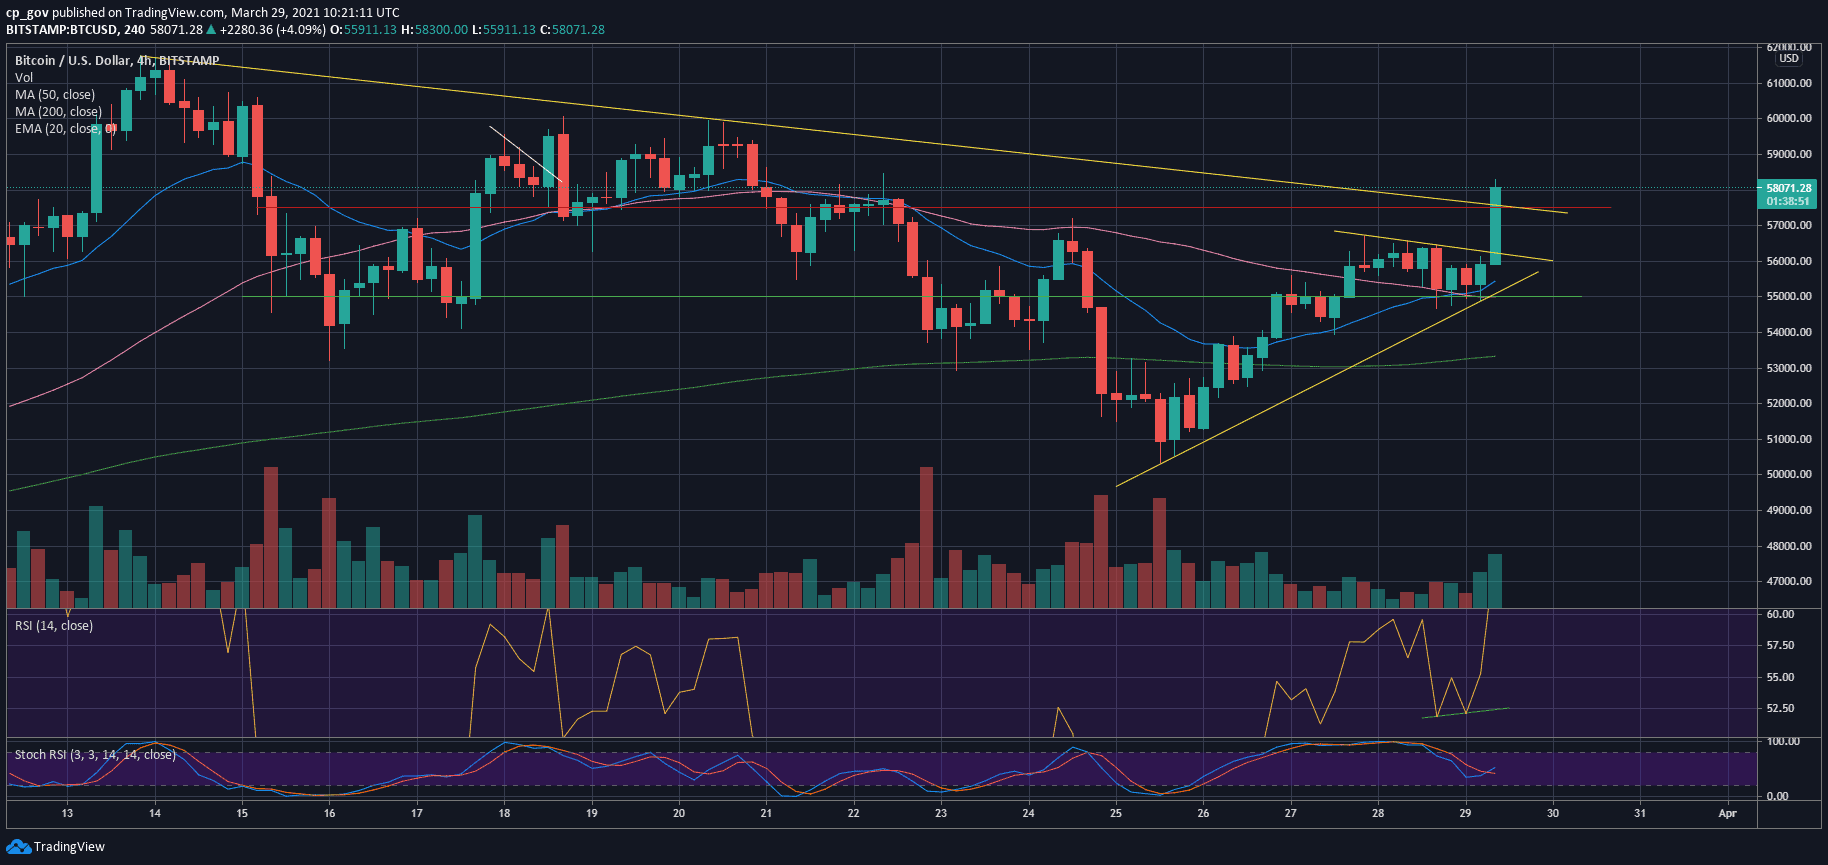
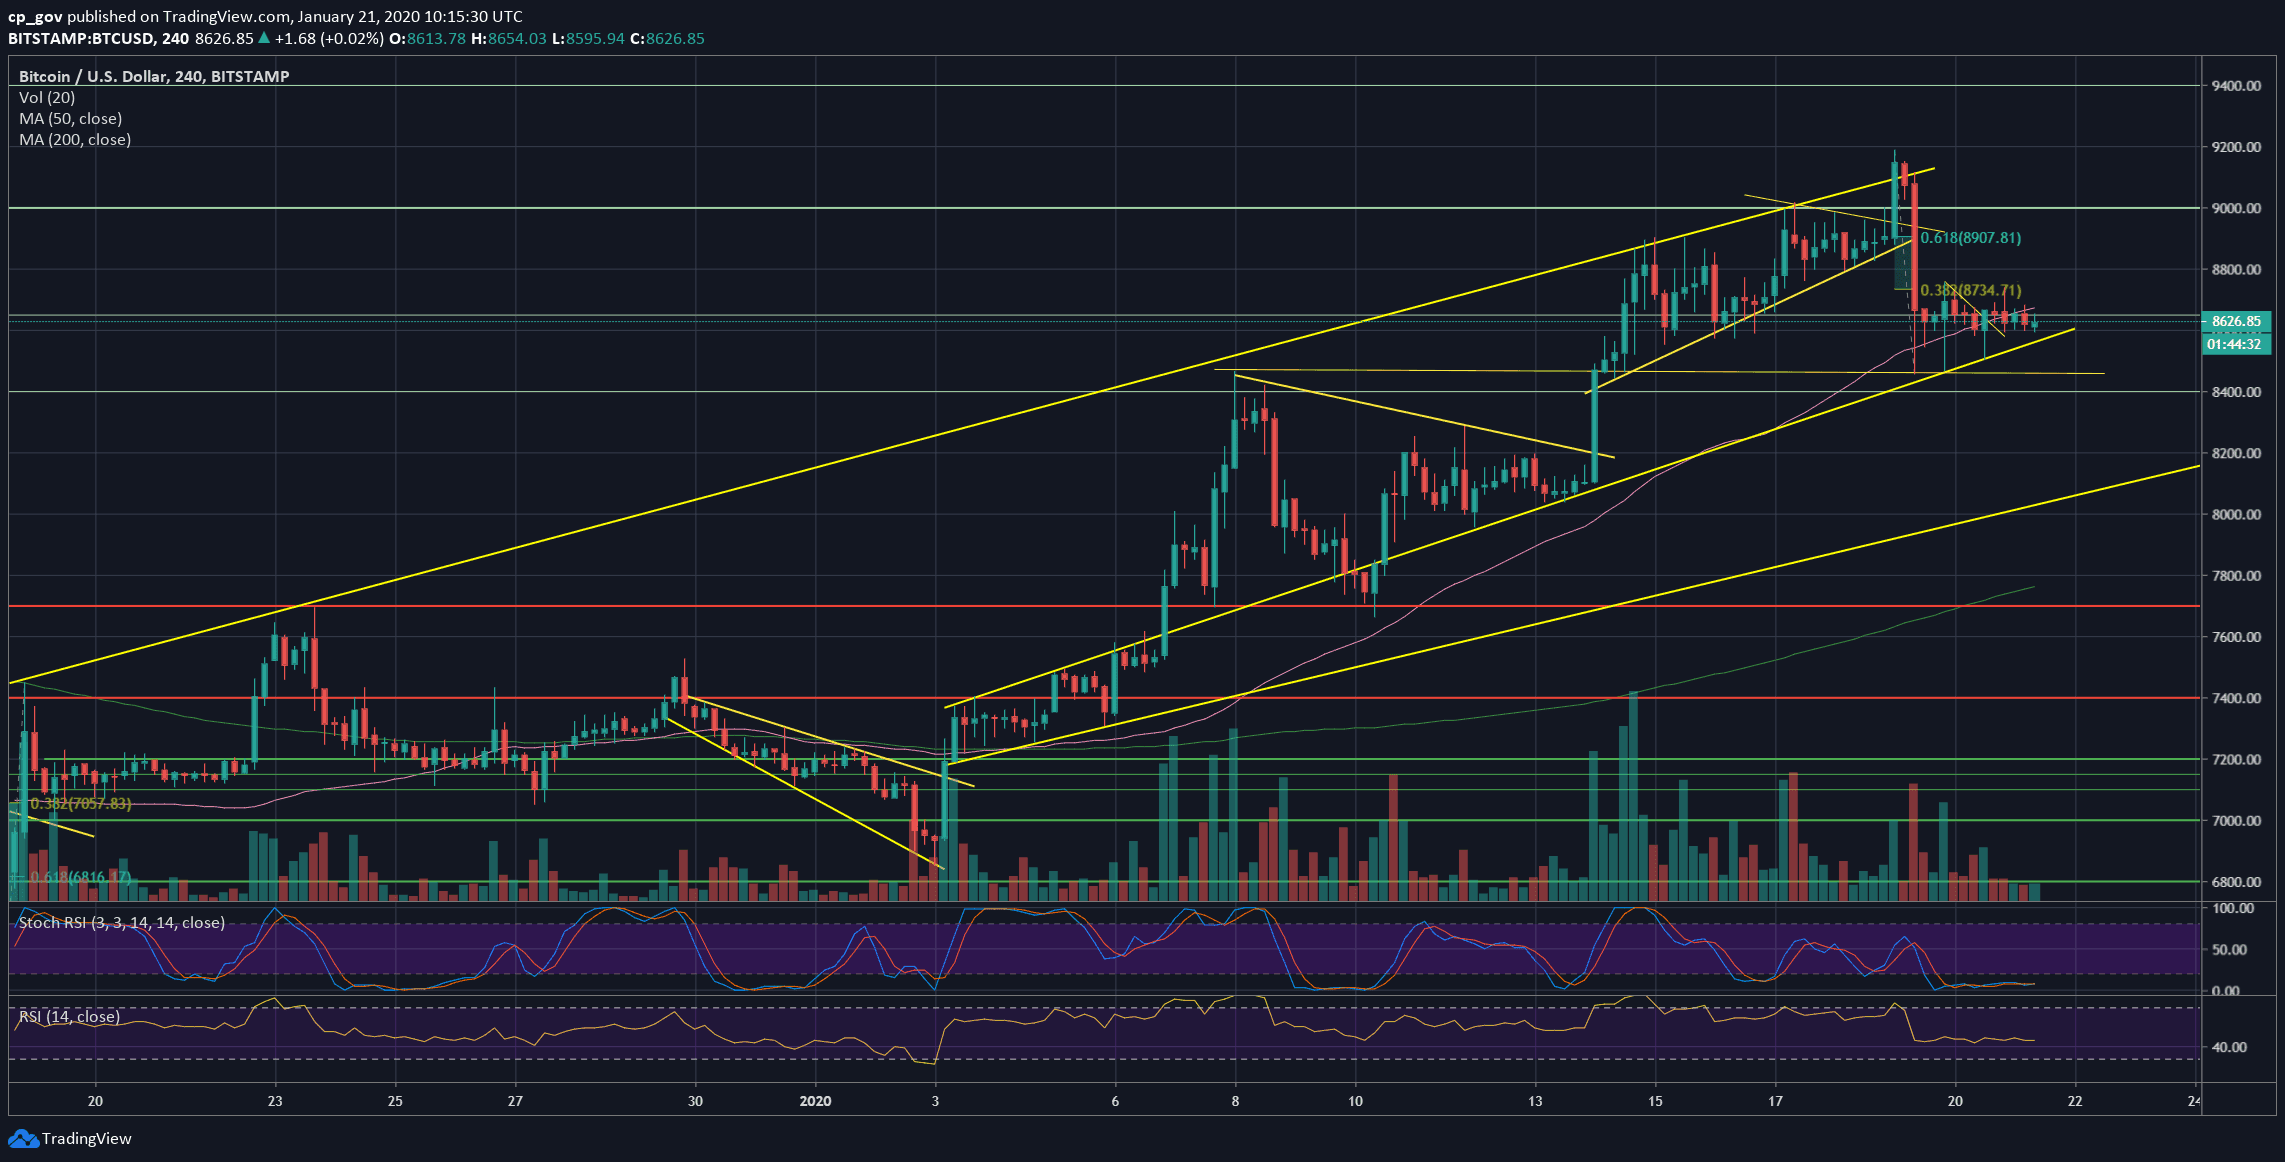
In the micro-level, we can see Bitcoin’s immediate correction reaching the 38.2% Fibonacci retracement level (~$8730) of the enormous price plunge, as can be seen on the following 4-hour chart.
Besides, the drop had reached the lower trend-line of the marked ascending channel on the 4-hour chart. Bitcoin respected that technical pattern since the beginning of the month.
Bitcoin Short-term’s Fragility
Usually, after a huge move like this, which is followed by a price consolidation period, another big move takes place. And this is precisely the situation here. Especially because Bitcoin is trading right by the lower marked trend-line.
The bulls would like to see Bitcoin finding support on top of the ascending line, and in general, not breaking the $8460 – $8600 range.
Total Market Cap: $238.7 billion
Bitcoin Market Cap: $157 billion
BTC Dominance Index: 65.8%
*Data by CoinGecko
Key Levels To Watch & Next Targets
– Support/Resistance levels: The bigger picture hadn’t changed since our previous analysis from two days ago.
The first line of support is the mentioned ascending trend-line (on the 4-hour chart). Further below is the double-bottom on the 4-hour’s chart, which is this week’s low at $8460.
A little below is the confluence zone of $8300 – $8400, along with the Fibonacci retracement level of 38.2% (of the January rise), before reaching the $8000 area, along with the 100-days moving average line (marked by white).
From above, $8730 – $8750 is still the first level of resistance Bitcoin will face (38.2% Fib level), which Bitcoin couldn’t overcome in the past two days. The next major resistance is $8900, along with the Golden Fib of 61.8%.
Further above is $9000, along with the most significant resistance at the current price area – the 200-days moving average line.
– The RSI Indicator: Following the recent price action, the RSI is showing some bearish signs, after breaking below the short-term ascending trend-line. The RSI is now facing support at 60.
The bearish momentum can also be seen in the Stochastic RSI oscillator, which is pointing lower following a crossover in the overbought territory.
– Trading volume: The recent price plunge didn’t carry a tremendous amount of volume, as compared to last month’s average volume levels. Yesterday ended with a relatively low amount of volume, maybe because of the holiday in the US.
BTC/USD BitStamp 4-Hour Chart
BTC/USD BitStamp 1-Day Chart
The post Bitcoin Price Analysis: The Calm Before The Storm? BTC’s Trying To Maintain The Crucial Support Line appeared first on CryptoPotato.