Bitcoin Price Analysis: The Bullish and The Bearish Case for BTC Following 5% Weekly Crash
Bitcoin’s price has been trending lower since the beginning of June, failing to recover toward its all-time highs. Still, the bull market seems to be far from over.
Technical Analysis
By TradingRage
The Daily Chart
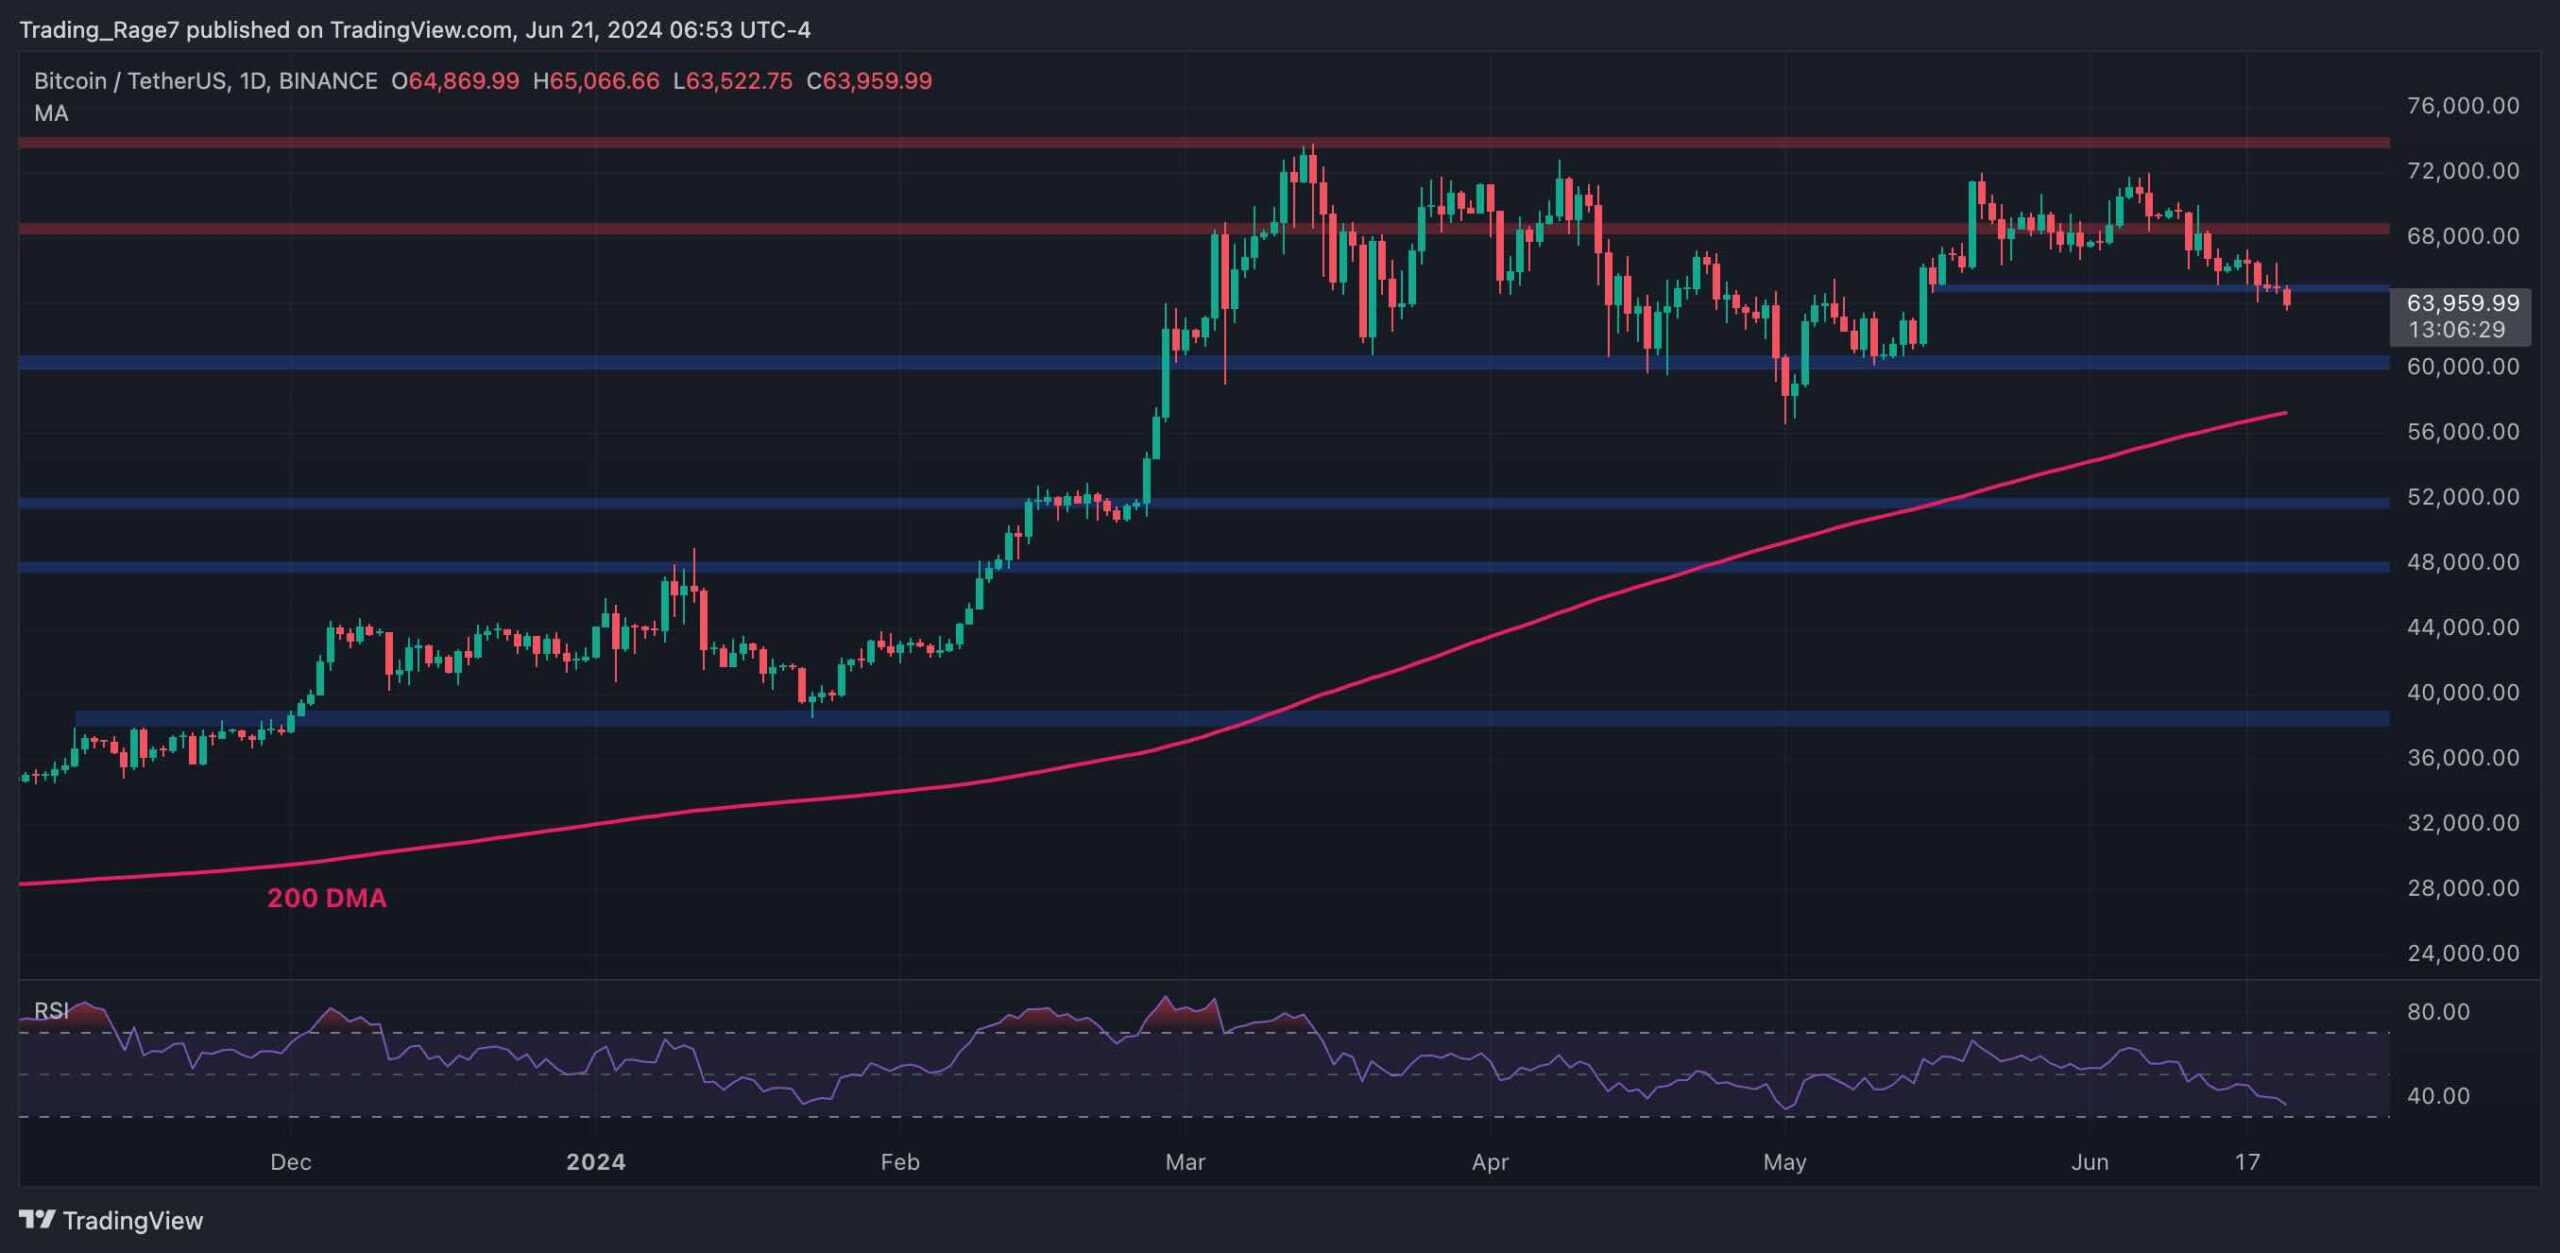
On the daily timeframe, the price has declined since failing to hold above the $70K mark. The $65K support level has also been broken to the downside, and BTC is dropping toward $60K. If this level also fails to hold, the 50-day moving average, around the $58K mark, would be the last resort.
The RSI also shows values below 50%, which suggests that the momentum is bearish again, and a drop toward the $60K level is highly probable.

The 4-Hour Chart
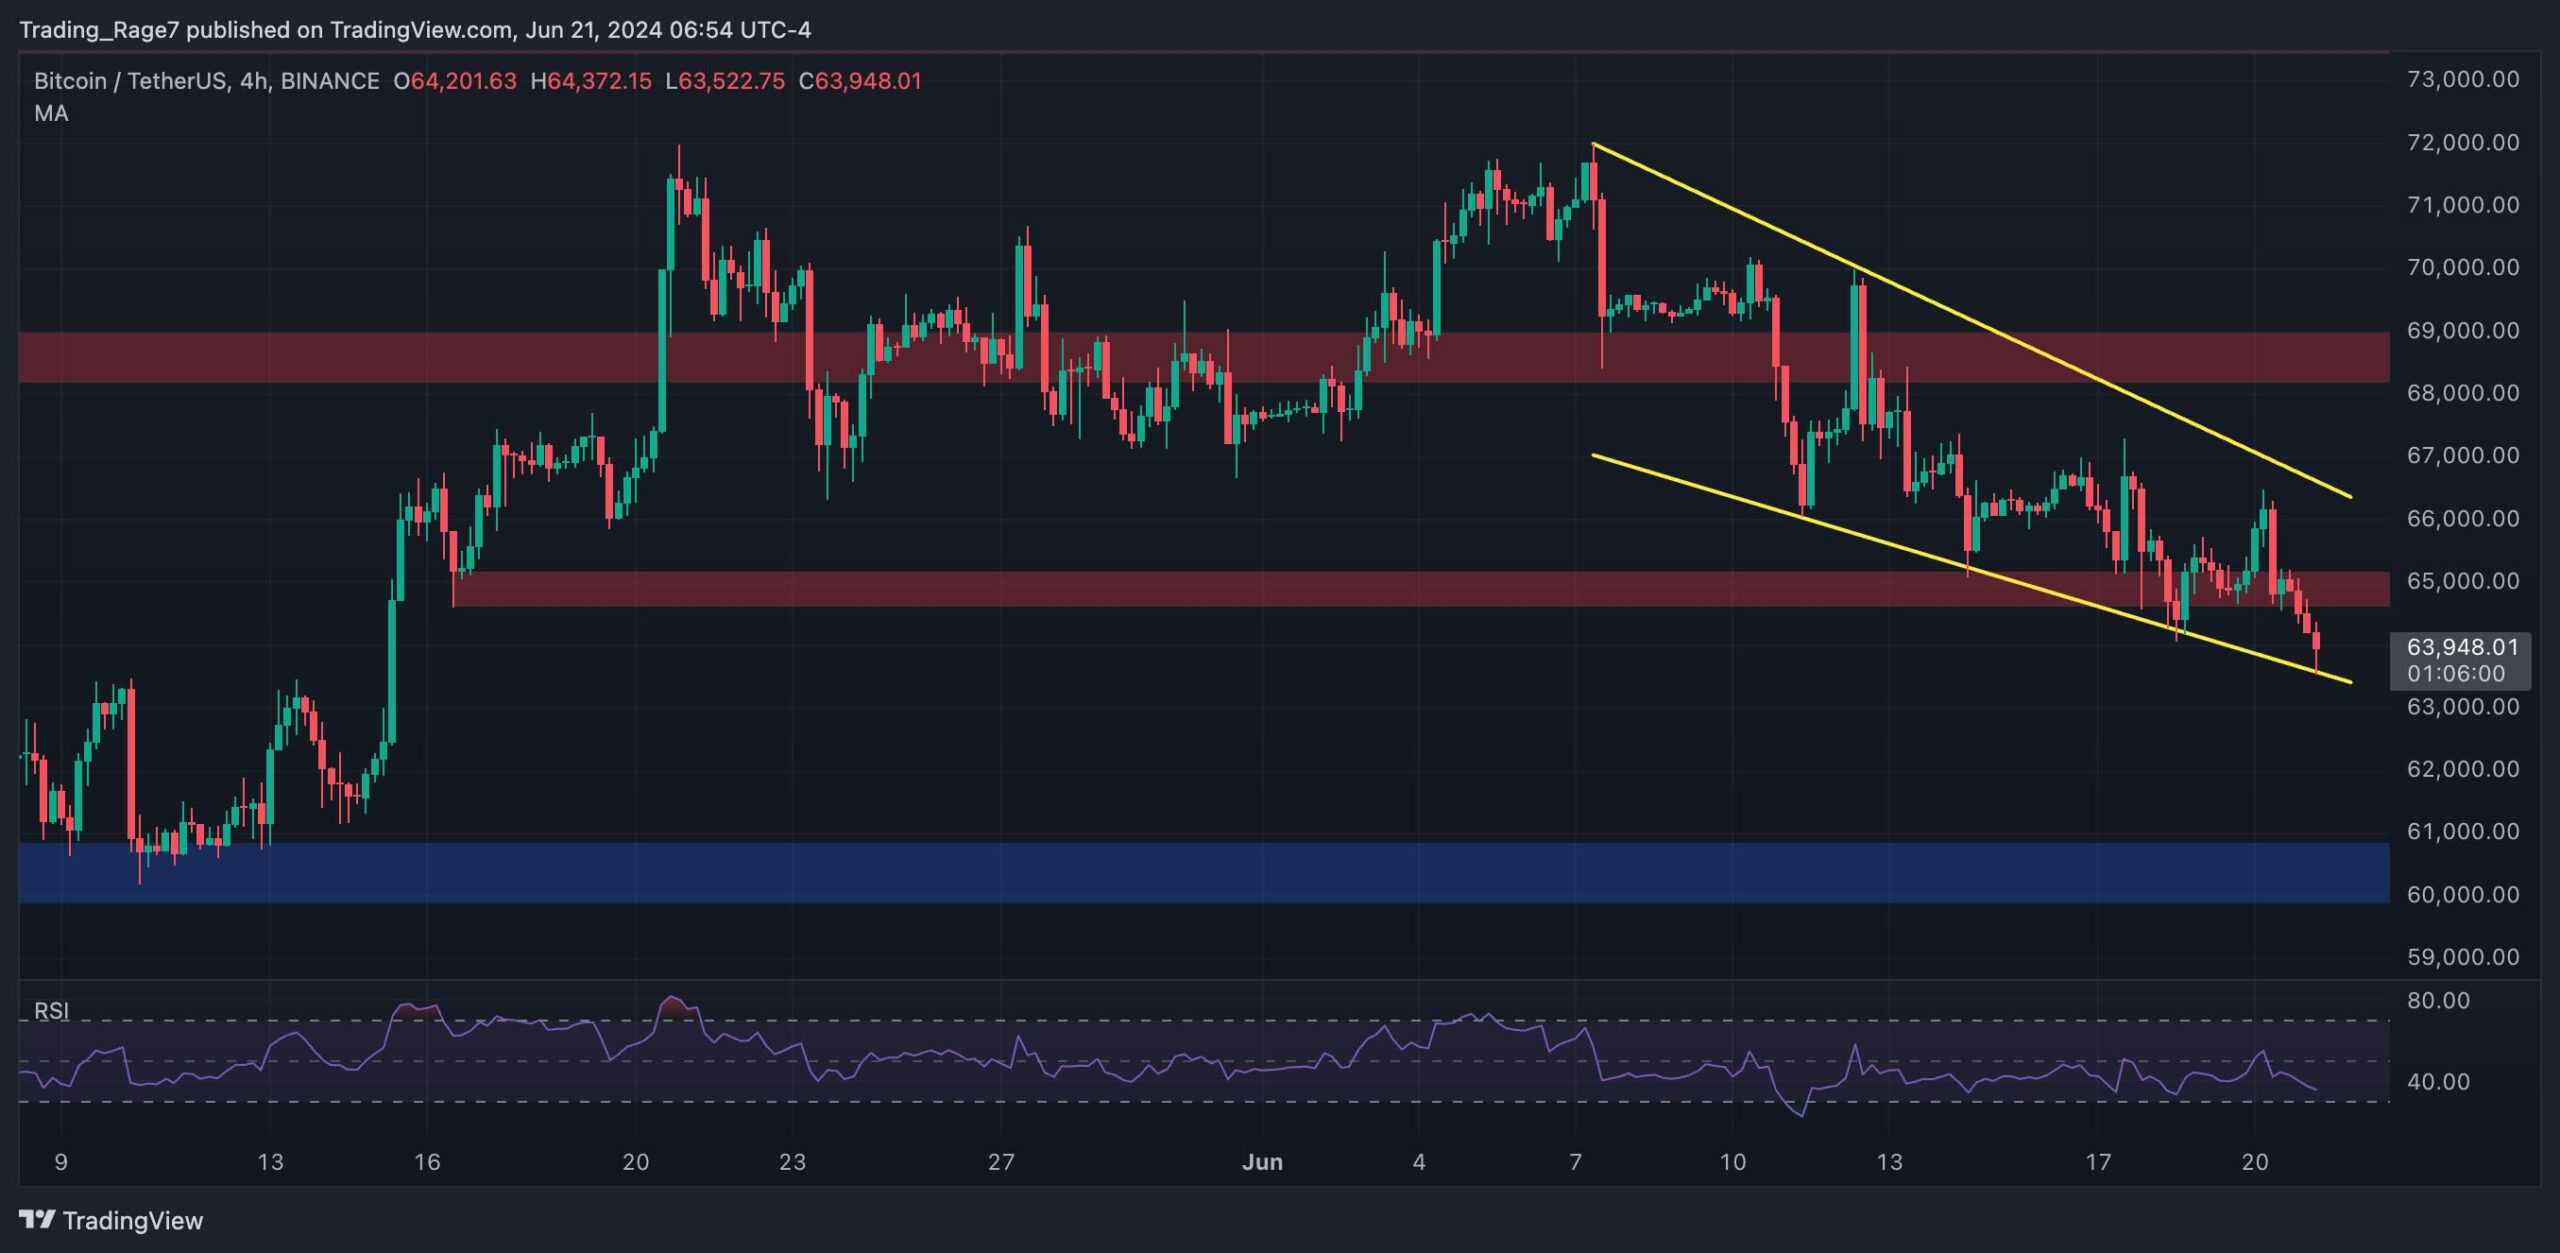
Looking at the 4-hour chart, the price has been forming a falling wedge pattern recently. If the market breaks the wedge to the upside, the cryptocurrency will likely begin a new bullish move.
However, with the $65K support level lost and the price currently testing the channel’s lower boundary, a bearish breakout might be on the cards. In this case, a drop toward the $60K zone would be imminent in the short term.

The post Bitcoin Price Analysis: The Bullish and The Bearish Case for BTC Following 5% Weekly Crash appeared first on CryptoPotato.


