Bitcoin Price Analysis: The Anticipated Weekend Move Had Arrived, Are The Bears Done Plunging BTC?
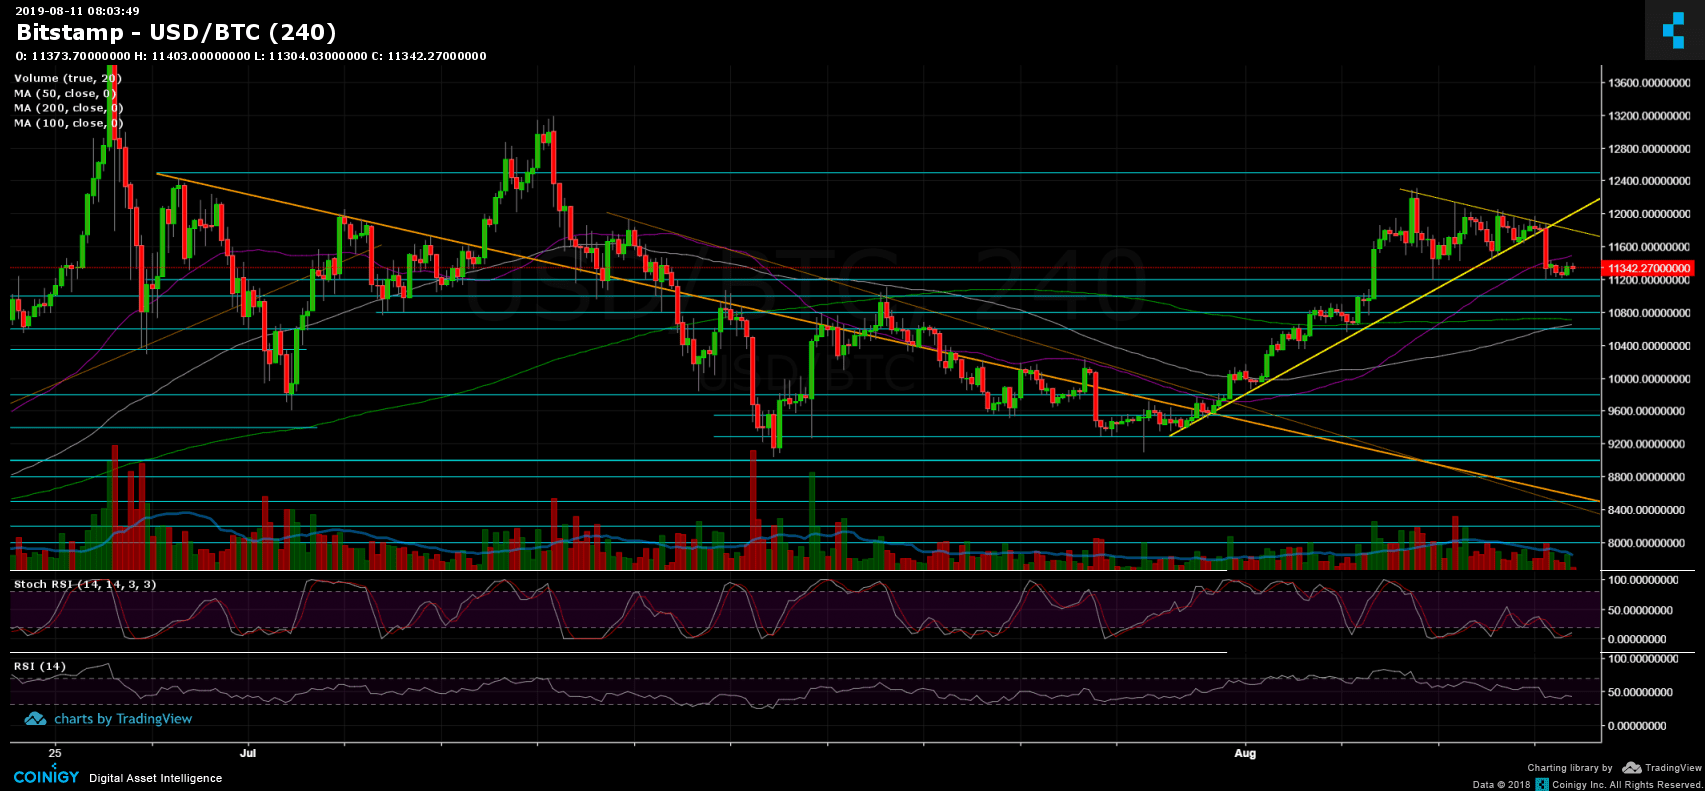
On our previous Bitcoin price analysis, we mentioned the significant horizontal triangle pattern seen on the 4-hour chart, and that a breakout followed by a sharp move is a matter of hours.
Yesterday we had seen the triangle getting broken, to the downside. Bitcoin quickly lost $700 – leaving the $11,900 area down to the marked support level at $11,200.
Does this mean Bitcoin is bearish again? It’s way too early to say. Since breaking down, Bitcoin is going under consolidation between the $11,200 support and the $11,500 resistance level. Such consolidation might end up with a retest of the above triangle’s descending trend-line, while the $11,200 could break down, on its way to lower levels ($10,800?).
Once again, the weekend proved to be perfect timing for the whales to move the crypto markets. Another thing we saw is Bitcoin dominance capturing the 70% impressive target. However, since touching it, along with the $700 price drop, the dominance is down by 1.3%.
Total Market Cap: $295 billion
Bitcoin Market Cap: $203.6 billion
BTC Dominance Index: 68.7%
*Data by CoinGecko
Key Levels to Watch
– Support/Resistance:
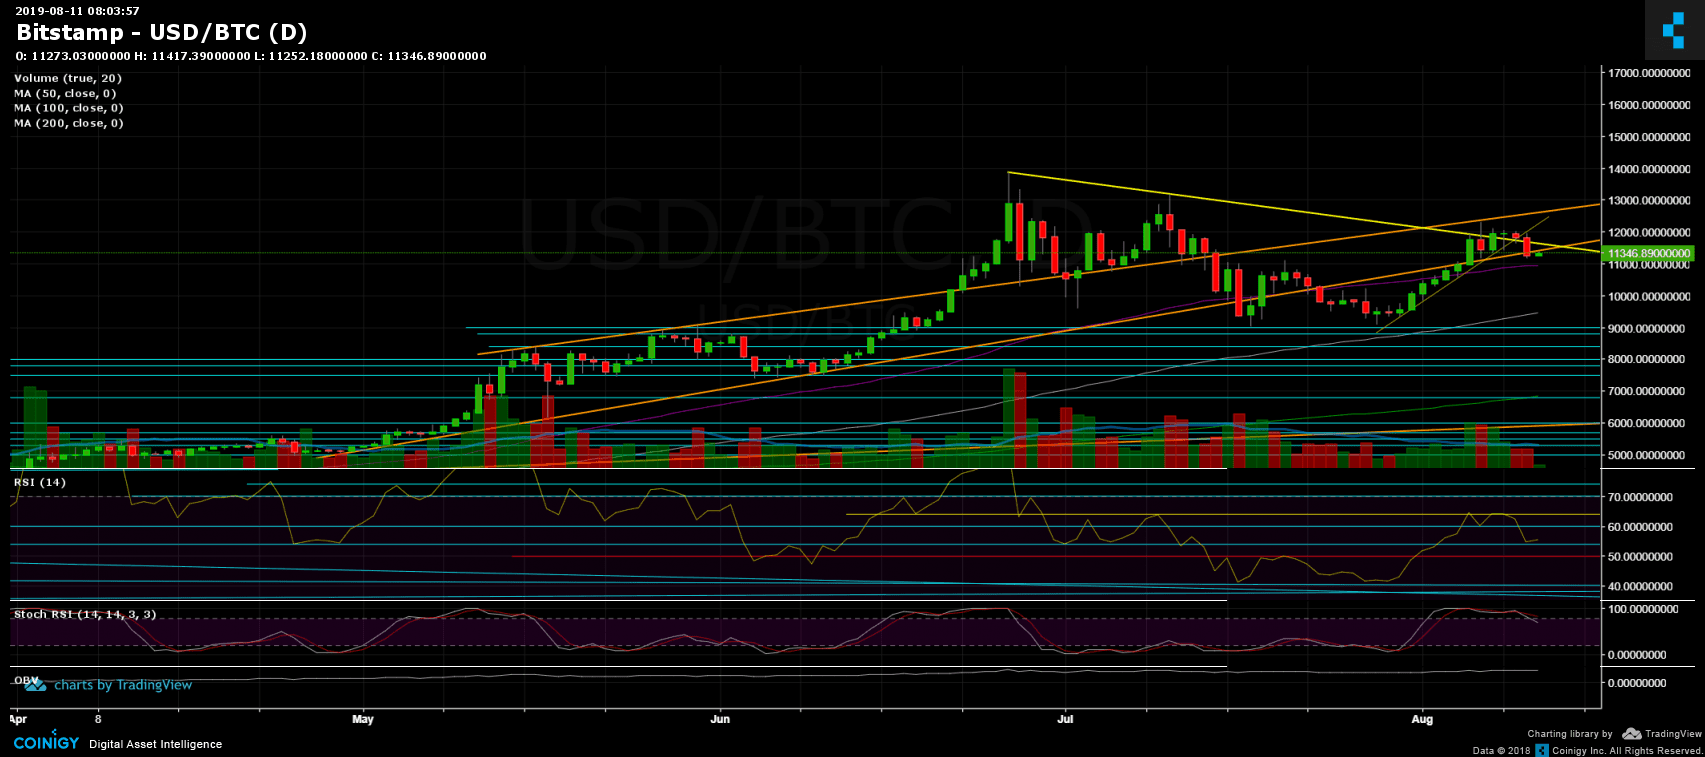
Following the breakdown, Bitcoin is now facing the $11,200 support zone, before reaching the $11,000, which contains the 50-days moving average line (marked purple on the daily chart). Further below lies $10,800, which by many, could be the target for this current bearish move. Further below lies $10,600 and $10,250 before the $10,000 mark.
From above, the $11,500 – $11,600 level had been turned into resistance. This also contains the 4-hour’s triangle descending trend-line (marked by yellow). Above is the $12,000 and $12,300. The last was the recent days’ resistance zone.
– Daily chart’s RSI: The RSI found support at the 54 horizontal supporting line, still in the bullish territory (above the 50, marked in red). However, the stochastic RSI oscillator had produced a bearish cross-over at the overbought territory, which might support seeing lower lows in Bitcoin in the coming days.
– Trading Volume: Volume of the past three days is low. This is anticipated and can be explained by the consolidation followed by the weekend.
BTC/USD BitStamp 4-Hour Chart
BTC/USD BitStamp 1-Day Chart
The post Bitcoin Price Analysis: The Anticipated Weekend Move Had Arrived, Are The Bears Done Plunging BTC? appeared first on CryptoPotato.