Bitcoin Price Analysis: Steady But Fragile Weekend – Can BTC Recover Above $7000?
The recent week was not the best for Bitcoin’s price, which lost almost 20% in just seven days.
The bad thing is that it’s still hard to see the end of those severe declines. However, if you look for a positive sign, you can find it in the fact that yesterday’s daily candle finished green, for the first time following five ugly red candles.
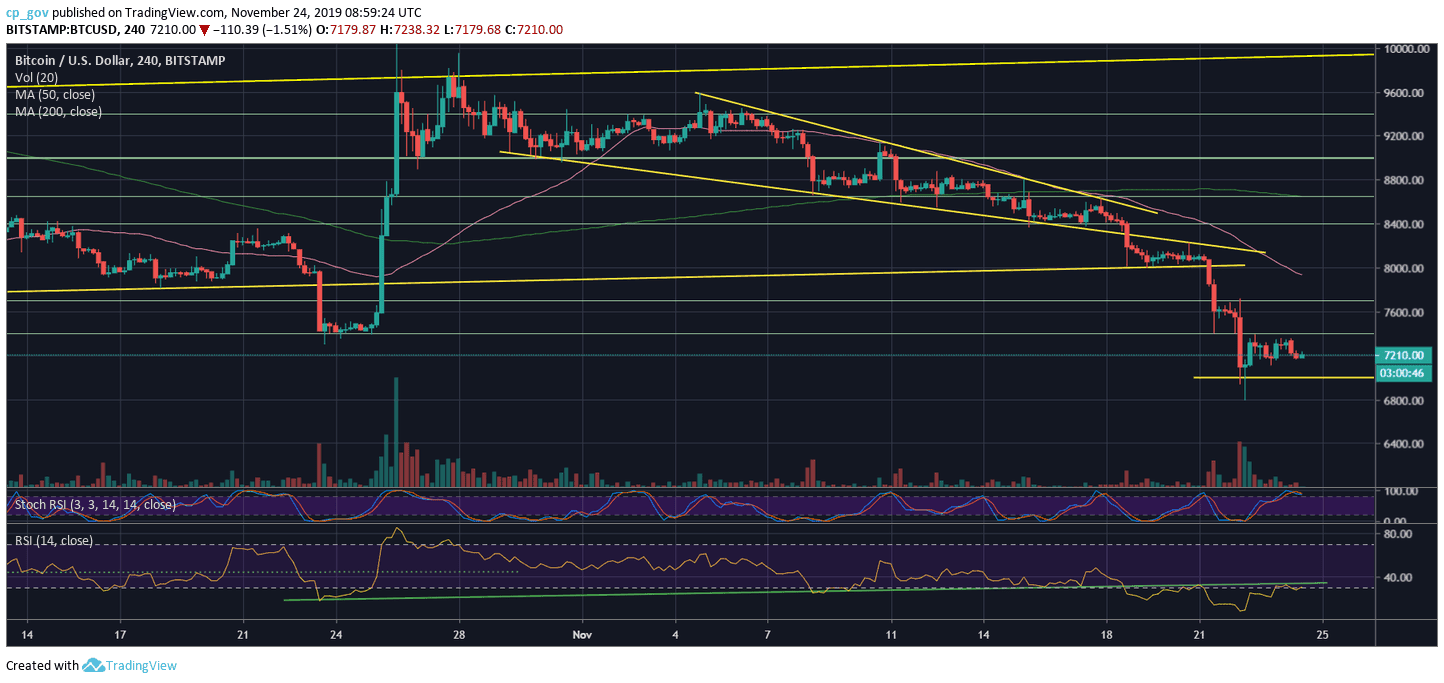
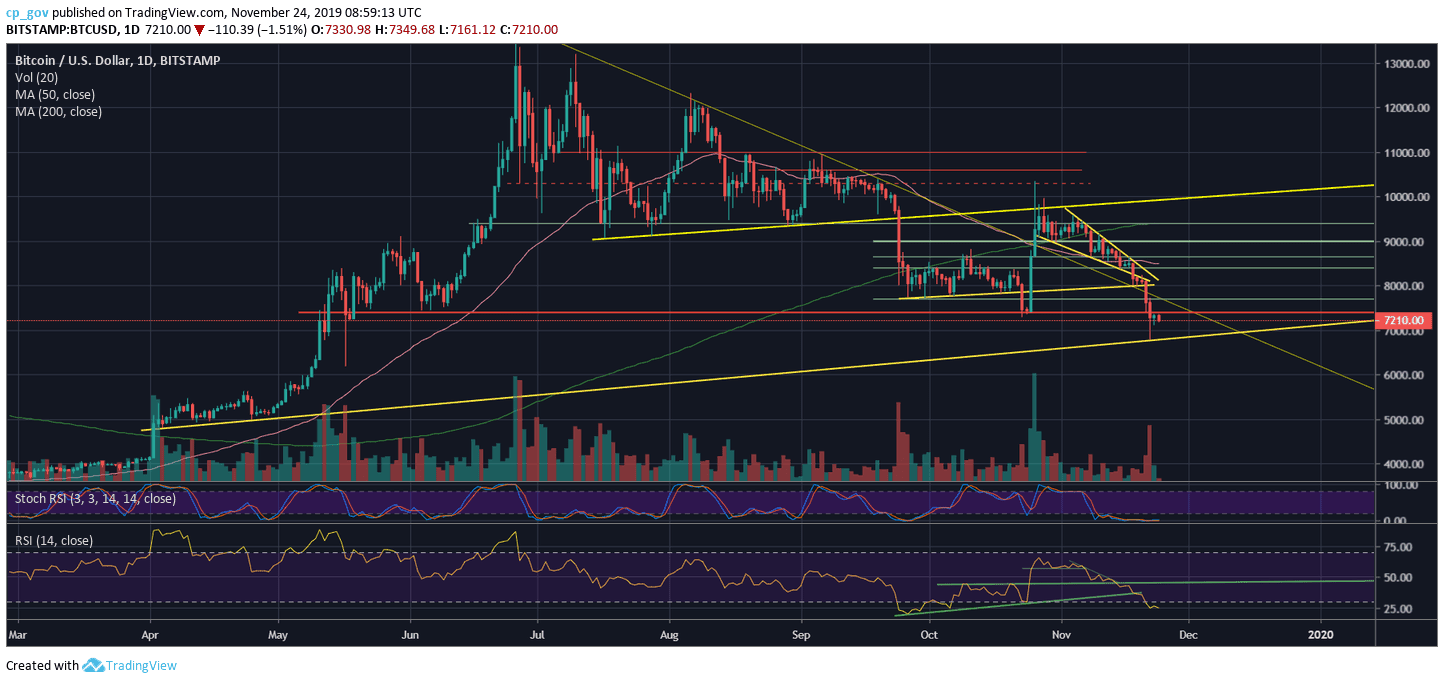
Looking at the following daily chart, we can see a secure area of support around $6800 – $7000. After dropping to those levels during last Friday, Bitcoin quickly corrected back above $7000, to where it’s currently trading now.
Another thing to keep in mind is the CME Futures trading periods. It appears that Bitcoin respects the price gaps created at the times when the CME is off (during weekends). Hence, there is also a high chance that the price action calmed a bit and will continue its volatility once CME goes back again on Monday morning (US time zone).
Total Market Cap: $199.3 billion
Bitcoin Market Cap: $131.6 billion
BTC Dominance Index: 66.1%
*Data by CoinGecko
Key Levels to Watch
– Support/Resistance: As mentioned above, the first level of support is $7000 – $7100. In case of a break-down, we would expect Bitcoin to reach $6700 – $6800 quickly, which was the low of Friday and the lowest price Bitcoin had seen since May 17.
Further below is $6500 (weak support), before $6200 and $6000. The last was served as legendary long-term support throughout the bearish year of 2018.
From above, Bitcoin will look to break the $7300 – $7400 resistance, before $7700 (Bitcoin actually tested the last following the Friday price drop).
A real change of momentum is possible only when breaking back above $8000, which now seems far from reality.
– The RSI Indicator: The RSI, the momentum indicator, tells the same story. As of now, the 25 crucial support level (which is the low from Friday) is still close to being tested once again.
Stochastic RSI oscillator is pointing on oversold on the 1-day chart (for the past two weeks already). This can lead to a possible positive correction in the case of a cross-over.
– Trading volume: Friday ended up with the highest volume since October 26, the day when Bitcoin saw the tremendous 42% price gains. Yesterday, as expected, didn’t carry a high amount of volume.
BTC/USD BitStamp 4-Hour Chart
BTC/USD BitStamp 1-Day Chart
The post Bitcoin Price Analysis: Steady But Fragile Weekend – Can BTC Recover Above $7000? appeared first on CryptoPotato.