Bitcoin Price Analysis: Slow Upward Drift Tests Market Supply

A slow, grinding upward drift has been the name of the game for bitcoin’s market over the last few weeks. The upward drift is bringing us slowly to a level that was previously rejected violently:
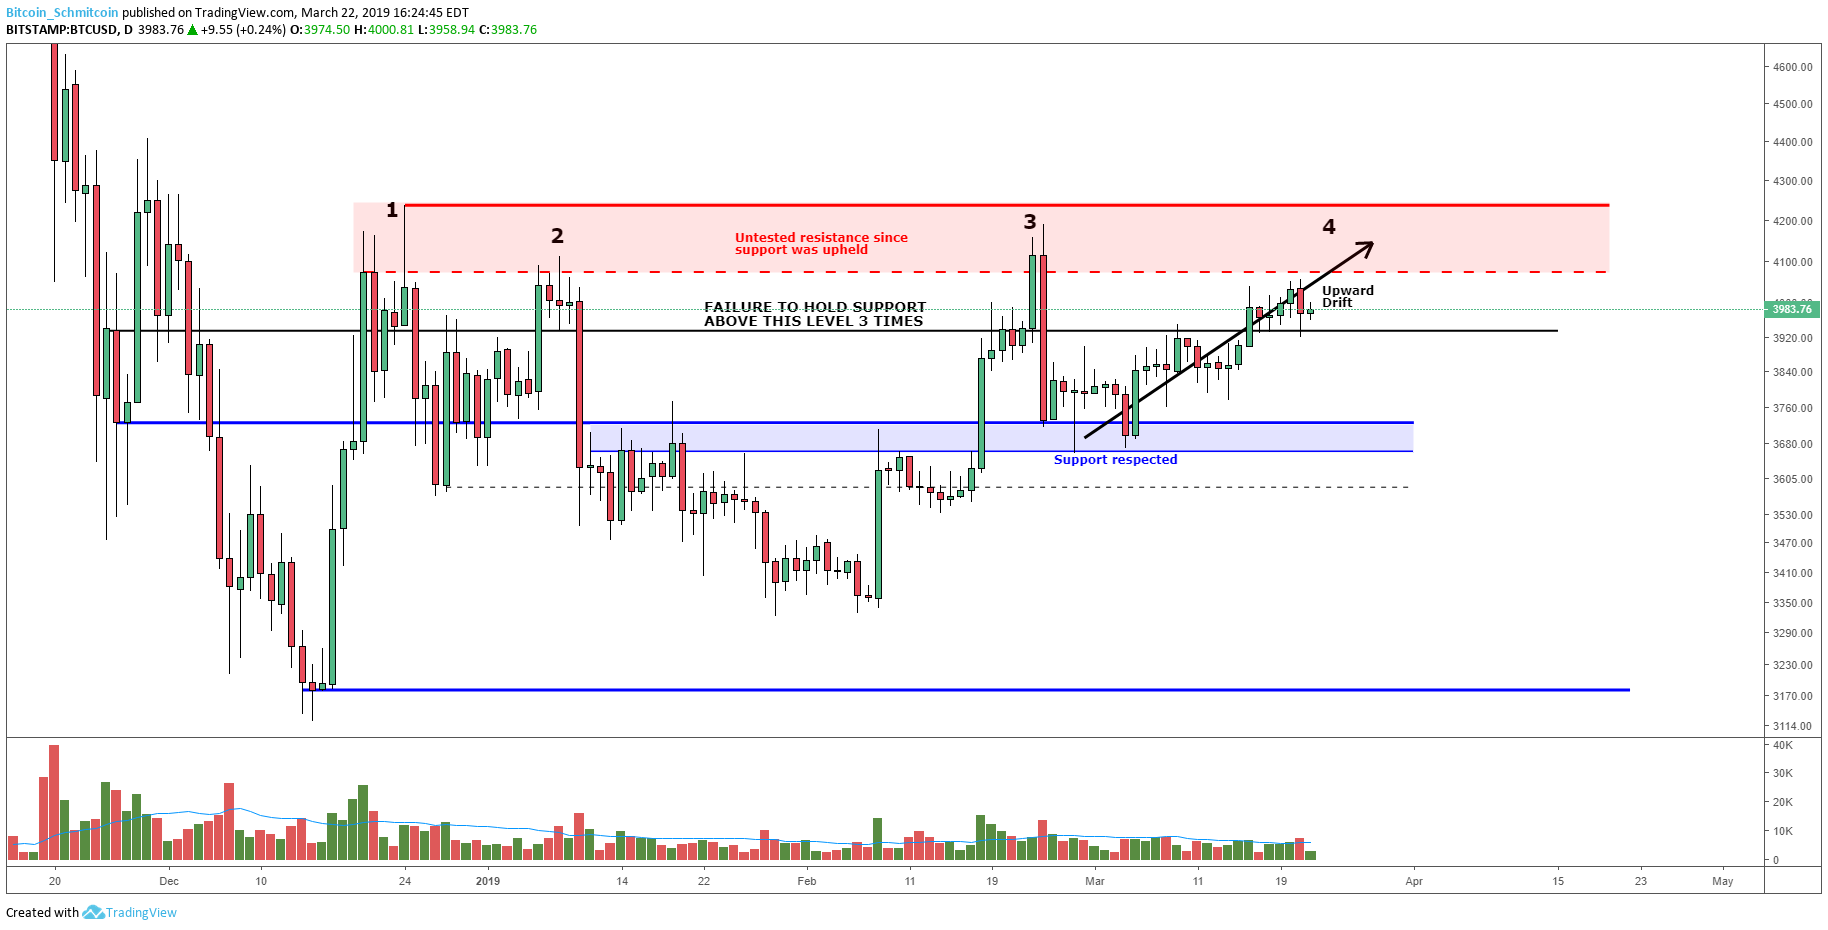
Figure 1: BTC-USD, Daily Candles, Upward Drift
Our third rejection of the red resistance level shown above brought the market into a test of macro support in the mid-$3,000s. After several tests of the support level, the market began to slowly drift upward in a stair-stepping manner. This upward drift is a change of character in price action. Prior to this drift, the market was quite volatile, with both upward and downward impulses. The three prior rejected tests shot into the level aggressively (a sign of strong demand) but got spat out aggressively (a sign of strong supply). Our fourth time is quite different, though — rather than shoving into the level aggressively, it is slowly grinding. Slow upward grinds are often a sign of weakening supply and persistent demand.
So far, our market has managed to hold macro support and has even managed to hold above the previously rejected level (outlined in black in Figure 1). Now, we are beginning to see the real test of supply as we enter the prior levels that were rejected:
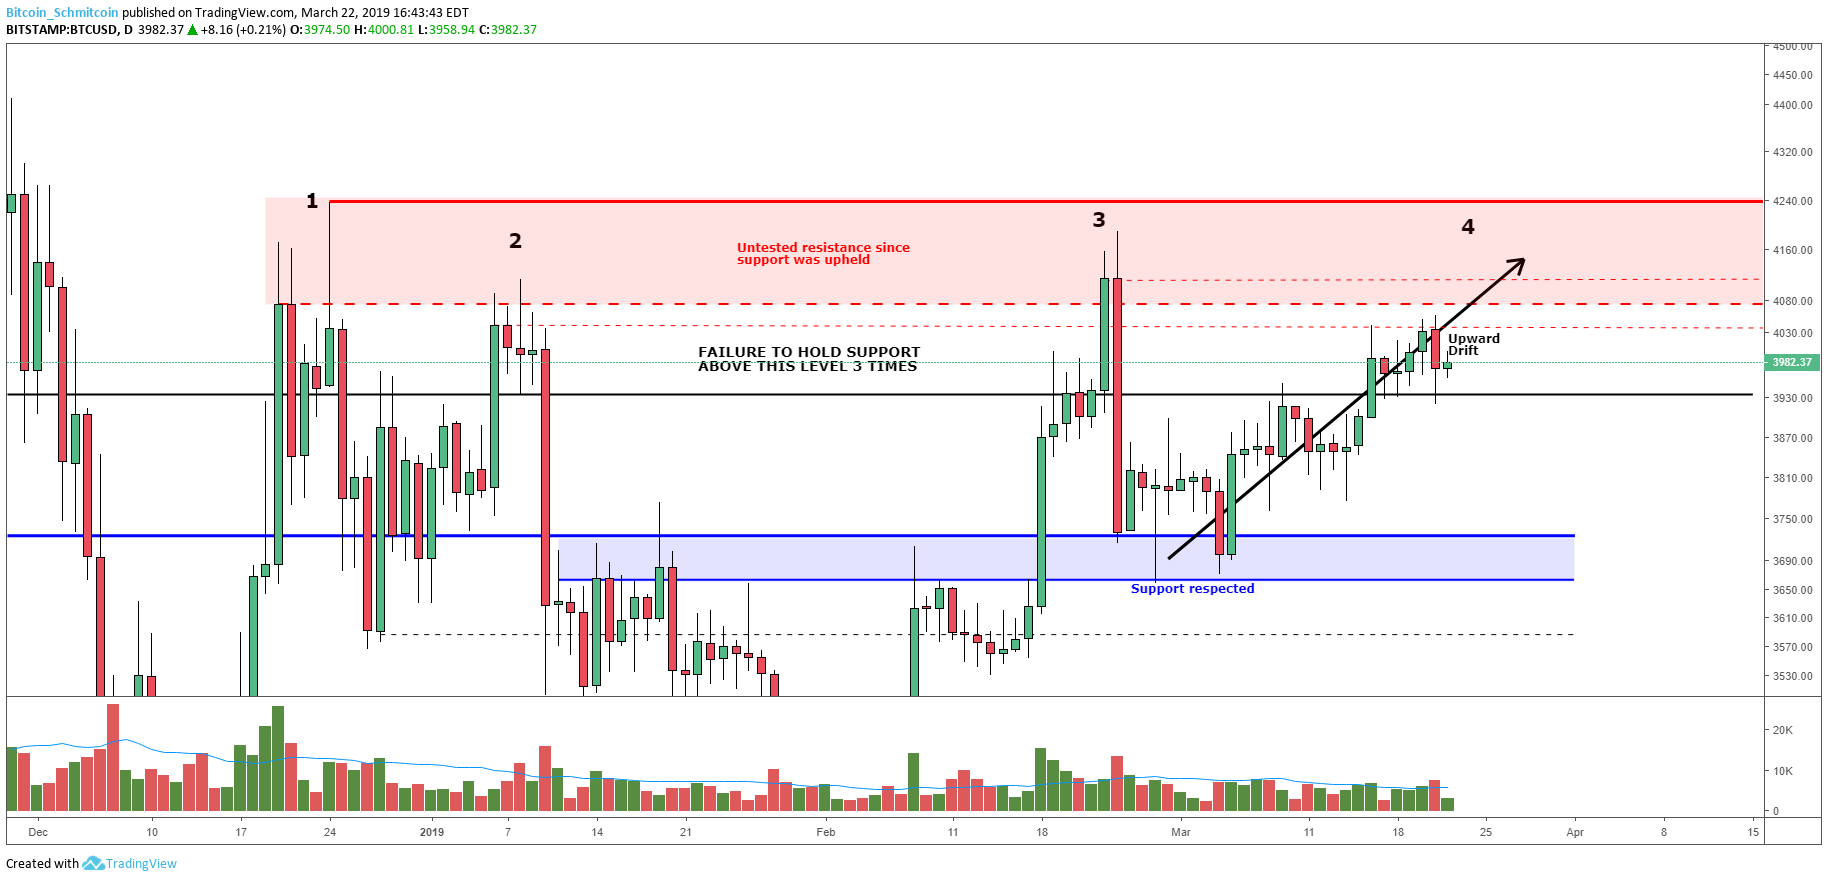
Figure 2: BTC-USD, Daily Candles, Prior Rejected Levels
If we look at the rejected levels individually, we can form discrete layers of resistance that the market will need to overcome if the bulls are going to overwhelm the market’s supply. At the time of this writing, we are in the process of testing the lowest level (shown by the red dashed line in Figure 2). A decisive close above that level would be a nice step as this slow grind is trapping more and more shorters that are beginning to fade the market move. If the market clears the lowest low, it will then enter into the red zone outlined above. This zone will likely see a lot of volatility as it has historically been a strong point of resistance. However, something to note is that this level is also a logical place for short-sellers to place their stops. If we see a strong move into this level, it’s entirely possible that we’ll see a short squeeze as shorters begin to close out their positions (willfully or forcefully).
Another characteristic of this drift that is important to note is the volume. The volume throughout this drift has been constant and the selling pressure has been relatively weak:

Figure 3: BTC-USD, Daily Candles, Constant Volume
Steady volume accompanied by upward-drifting markets is often a sign of not only bearish exhaustion, but also supply absorption. Supply absorption is simply the act of soaking market supply like a sponge without aggressively pushing the market upward. It’s a passive accumulation technique that baits people into selling prematurely.
While we are still in the process of testing overhead resistance, this change of character in our market looks pretty bullish. The bullish trend will slowly confirm itself over the next few days/weeks if we manage to clear the overhead levels outlined above. For now, we need to see how the market reacts to all of the overhead levels and how the market treats bearish pressure. If we manage to close above the overhead resistance level, there is very little stopping the market from breaking out and seeing a sizable markup in price.
Summary:
- The market has continued its slow upward drift into overhead resistance. Slowly but surely, we are testing all the resistance.
- This upward drift is a change of character as the market has seen strong bouts of volatility leading into the drift. Now, however, we are grinding upward through each discrete resistance level.
- If we manage to close above the band of overhead resistance, we can expect to see a strong continuation of the uptrend as this would represent a break of market structure, and a breakout of strong overhead resistance.
Trading and investing in digital assets like bitcoin is highly speculative and comes with many risks. This analysis is for informational purposes and should not be considered investment advice. Statements and financial information on Bitcoin Magazine and BTC Inc sites do not necessarily reflect the opinion of BTC Inc and should not be construed as an endorsement or recommendation to buy, sell or hold. Past performance is not necessarily indicative of future results.
This article originally appeared on Bitcoin Magazine.


