Bitcoin Price Analysis Sep.16: A re-test of the critic support level
Since our previous price analysis, not much has changed. The overall picture is that Bitcoin is still inside the range between $6400 – $6600 . Here are the keys:
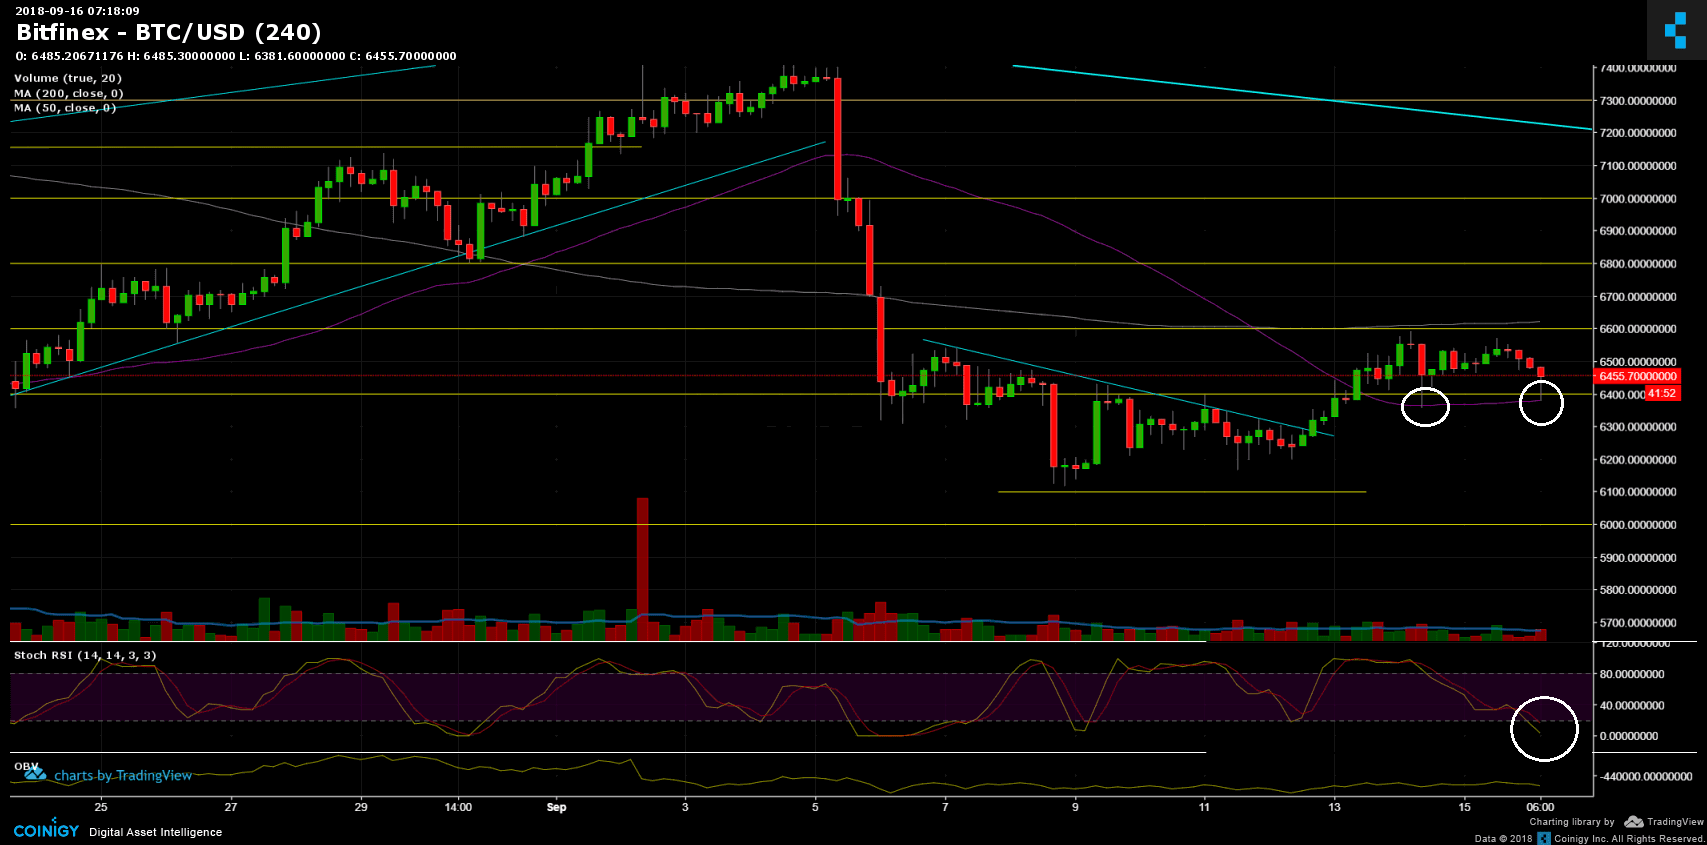
- Over the recent hours Bitcoin re-tested (again, after 48 hours) the critic support level at $6400 with a low at $6381 – the 50 days moving average line, marked in purple.
- RSI indicator is on its low levels, which points that the market is oversold.
- Trading volume is still pretty low. The reason can also be the weekend.
- Bitcoin is still inside the range of the two significant moving average lines: From the top there is the pink-line 200 days moving average, and from the bottom purple-line 50 days moving average. Breaking out of this range and Bitcoin is likely to produce a major move in that direction.
- As mentioned, resistance levels lie at $6600, $6800 (weak) and $7000 (strong).
- Support levels lie at $6400, $6300, $6100 before the critic level at $6000.
- Trading volume is in favor of the sellers, which supports the option of a correction and going back down to re-test support levels at $6400, $6200 and $6100.
- BTC shorts amount on BitFinex has been increased over the past 24 hours.
Like we stated before – The bullish movement is considered a correction to the bearish sentiment, unless breaking up the $7400 high that was reached a week ago.
Bitcoin Prices: BTC/USD BitFinex 4 Hours chart

Cryptocurrency charts by TradingView. Technical analysis tools by Coinigy.
The post Bitcoin Price Analysis Sep.16: A re-test of the critic support level appeared first on CryptoPotato.


