Bitcoin Price Analysis Sep.15: A change of momentum?
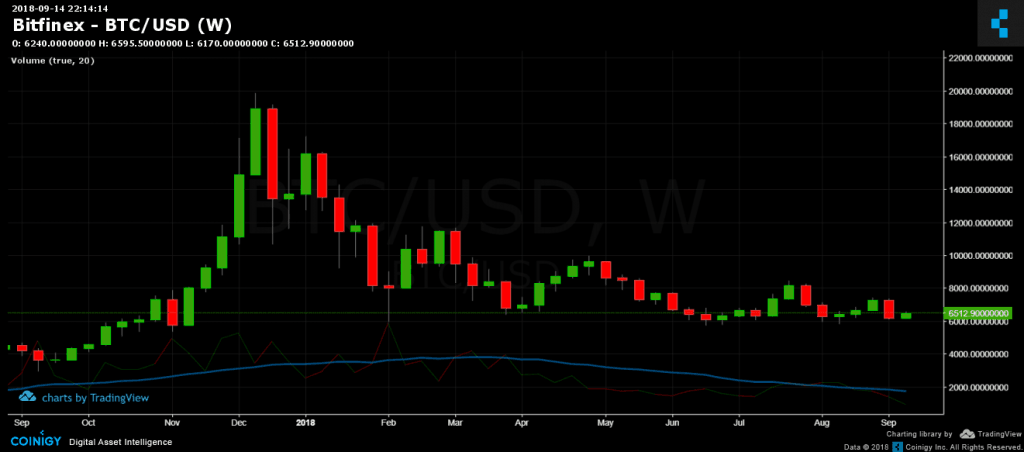
The past two days were pretty bullish for Bitcoin and even better for altcoins. The market is still under bear conditions. Bitcoin has to create a higher low in the weekly chart, something that has never happened since the beginning of 2018:
Back to the current situation:
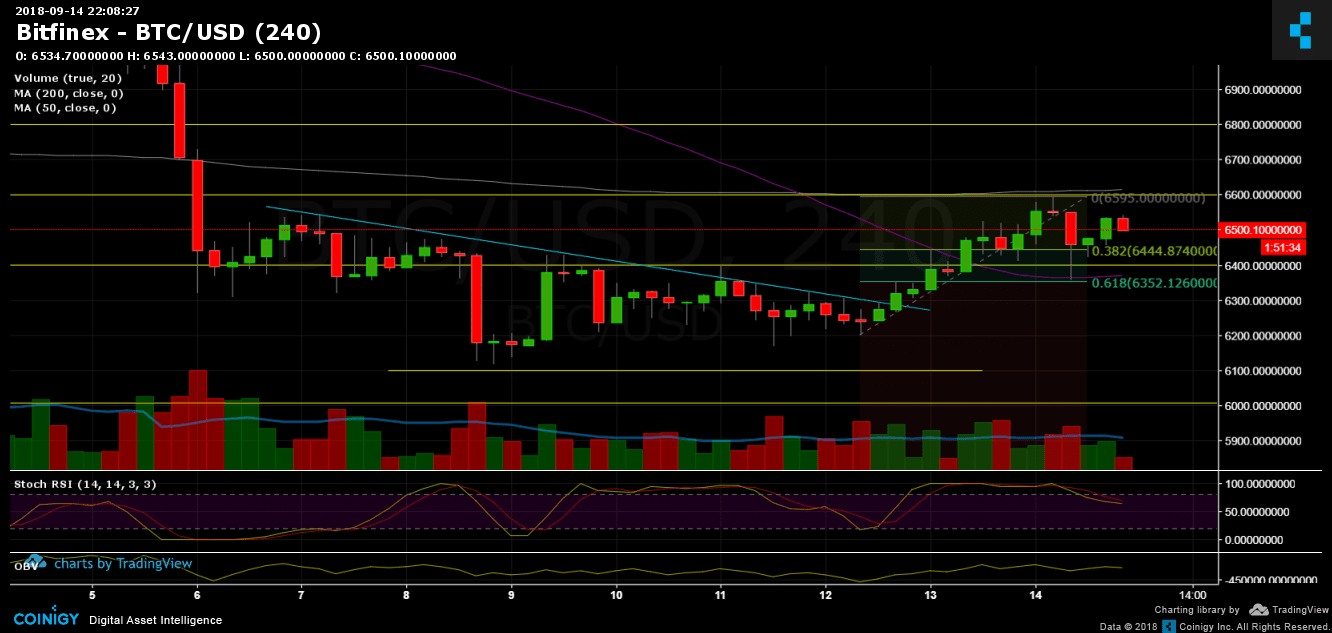
- The bullish movement is considered a correction to the bearish sentiment, unless breaking up the $7400 high that was reached a week ago.
- Over the last day Bitcoin re-tested support level at $6400 with a low at $6366 – moving average 50 days (purple line) and also Fibonacci retracement %61.8 level.
- The next major obstacle is the $6600 resistance level, along with moving average 200 days (the pink line). Breaking up $6600 will likely to lead a quick move to $6800 resistance area.
- Trading volume is in favor of the sellers, which supports the option of a correction and going back down to re-test support levels at $6400, $6200 and $6100.
- Over the past days, BTC shorts amount on BitFinex has been decreased. However, the amount is still high.
- To summarize – the key levels for Bitcoin are $6400 from below and $6600 from above.
Bitcoin Prices: BTC/USD BitFinex 4 Hours chart
Cryptocurrency charts by TradingView. Technical analysis tools by Coinigy.
The post Bitcoin Price Analysis Sep.15: A change of momentum? appeared first on CryptoPotato.