Bitcoin Price Analysis Oct.8: BTC is now facing the 2018 long-term line
That happened quick. As expected on our yesterday’s price analysis, Bitcoin produced a significant move. Not that major, but unlike the steady, stable past week – a daily movement of around $150 is considered something.
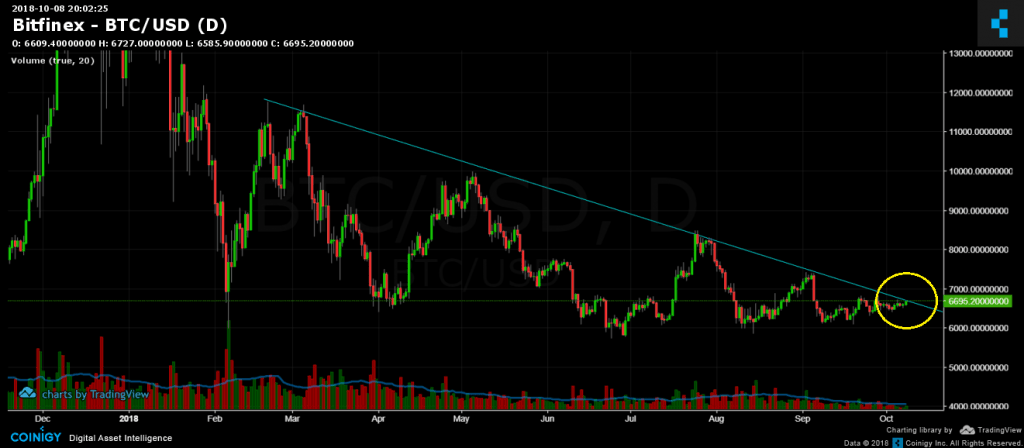
The more interesting fact is that Bitcoin is now facing (again) the long-term descending trend-line. This famous line started forming in February 2018, while one Bitcoin was at almost $12,000. Will we see it again? The first step that needs to take place is, of course, to break up our of this trend-line, following a massive trading volume.
The following hours/days could be critical to gain momentum for a possible breakout.
Now what?
- Volume of buyers is starting to gain momentum, but still needs to accumulate more.
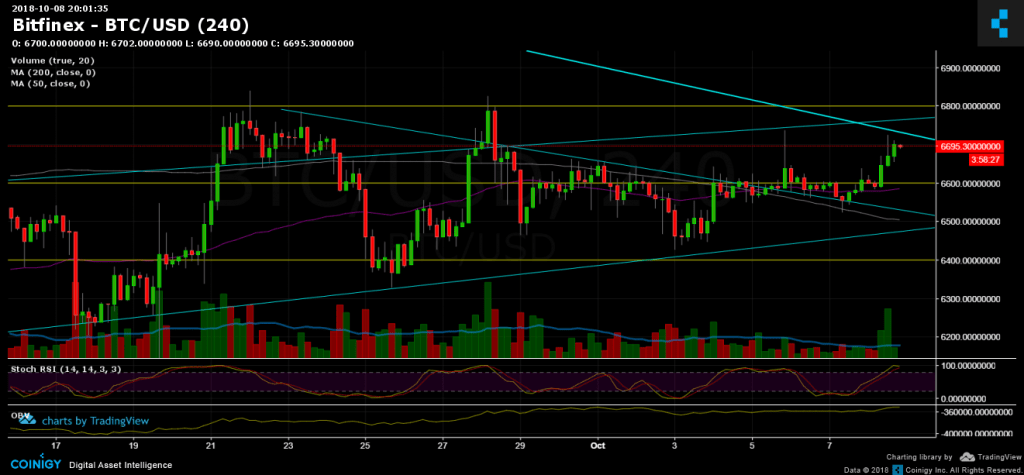
- From the bull side: Bitcoin is now facing resistance area at $6720 – $6800: the $6800 double top, along with long-term descending trend-line at around $6720 (current level as of writing this) and upper trend-line of the ascending channel at $6760. This creates a strong resistance area around the above.
- Closest support lies at $6600 (resistance along with 50 days moving average) and around $6500 (200 days moving average).
- RSI levels are at their high levels; We could expect a little correction before possible re-test of resistance zone.
- Bitcoin short positions on BitFinex respect the major resistance area and gained momentum.
BTC/USD BitFinex 1 Day chart
BTC/USD BitFinex 4 Hours chart
 Cryptocurrency charts by TradingView. Technical analysis tools by Coinigy.
The post Bitcoin Price Analysis Oct.8: BTC is now facing the 2018 long-term line appeared first on CryptoPotato.