Bitcoin Price Analysis Oct.4: The moving average conjunction will lead a move?
Following yesterday’s price analysis: “A bullish triangle is still an option, in case of not breaking down the support level at $6400, along with the ascending trend-line. From the optimistic side, Bitcoin will now be facing the 50 days moving average support-turned-resistance at $6550 and the 200 days at $6600.”
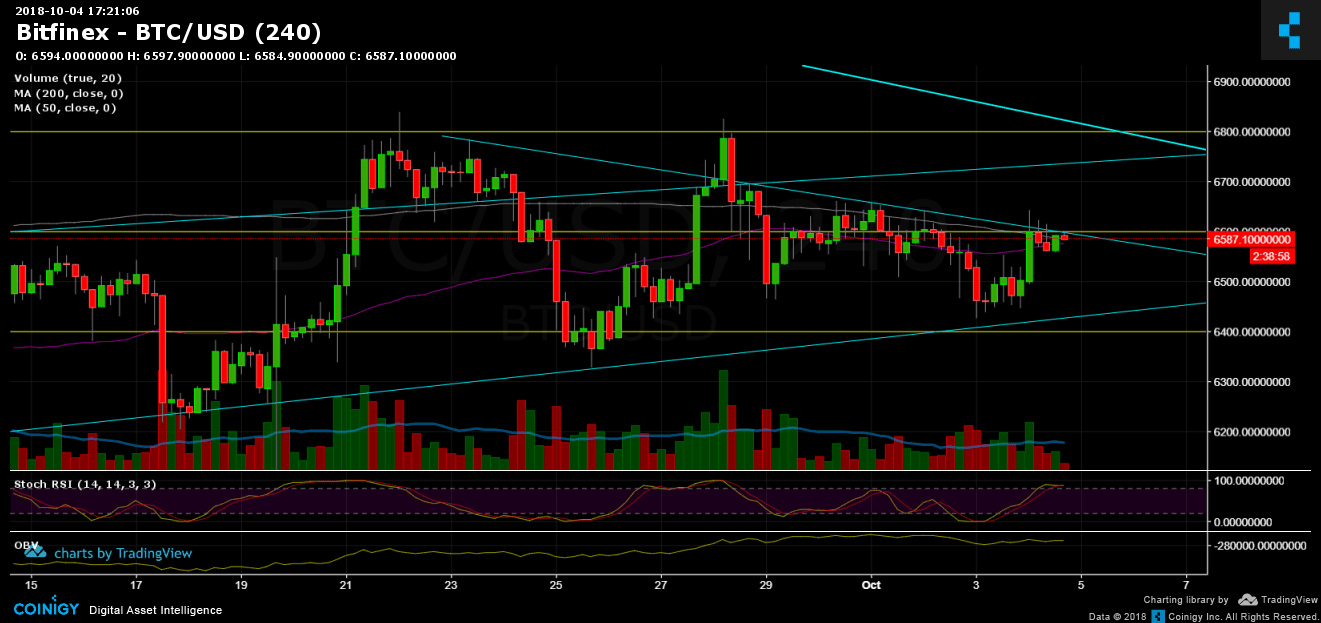
This is exactly what happened, while Bitcoin is still inside the triangle, as can be seen by the chart below. The low ascending line had been tested and support is holding.
As of writing, Bitcoin is testing the major resistance area of $6550 – $6600. This includes the resistance line at $6600 along with the two moving averages 50 and 200.
Now what?
- The two moving averages, 50 and 200 days, are about to meet up. A crossing up (50 over the 200) might be a bullish sign for the market.
- However, Bitcoin is still consolidating around the same range. The range becomes tighter and tighter. The two options are here: A bullish triangle break up at $6800 or the bearish scenario is the 1-day long-term bearish triangle in case of breaking down the $5700 – $5800 yearly low.
- Along with the tightening range, trading volume had decreased and is not significant over the past 1-2 days.
- Next major resistance level is at $6800 and $7000. Next support is the ascending line (around $6450) and $6300.
- RSI levels are at their high levels, market might need a correction down.
- Bitcoin short positions on BitFinex had decreased over the past 24 hours, but are still high compared to the past 10 days.
Bitcoin Prices: BTC/USD BitFinex 4 Hours chart
 Cryptocurrency charts by TradingView. Technical analysis tools by Coinigy.
The post Bitcoin Price Analysis Oct.4: The moving average conjunction will lead a move? appeared first on CryptoPotato.


