Bitcoin Price Analysis Oct.3: BitFinex Short Positions Are At 10-Day High
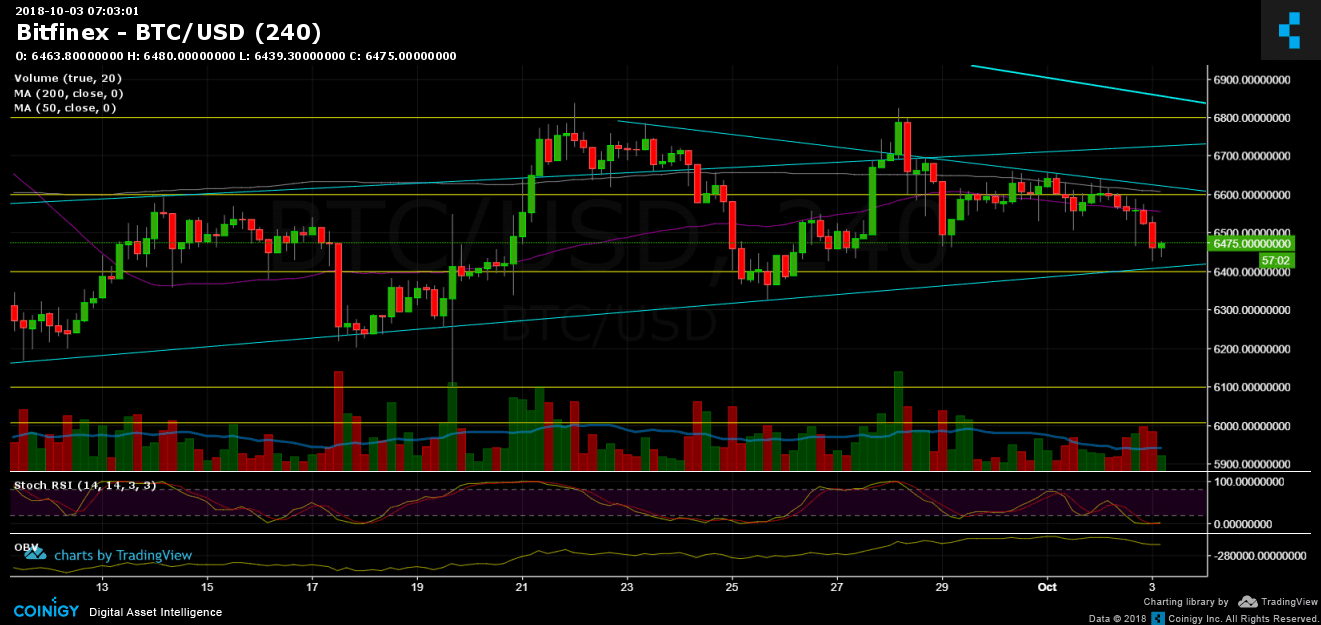
A quick update, following yesterday’s price analysis: Bitcoin is getting further from extracting the bullish triangle. The bear scenario is looking more and more realistic as Bitcoin broke the 50/200 moving averages tight range, and found support around $6400 (as of writing this update).
Now what?
- Sellers’ trading volume is getting higher and is also higher than the buyers’ volume. This indicates on money going out over the past day.
- A bullish triangle is still an option, in case of not breaking down the support level at $6400, along with the ascending trend-line. From the optimistic side, Bitcoin will now be facing the 50 days moving average support-turned-resistance at $6550 and the 200 days at $6600.
- The more likely scenario, as of writing these lines, is a re-test of $6300. Breaking it down might send Bitcoin to $6100 area.
- RSI levels are at their low levels, and Stochastic RSI indicator had crossed up. This may support a correction up in the next few hours.
- Bitcoin short positions on BitFinex had grown up significantly over the past hours, and are reaching their highest number over the past 10 days. Do they know something?
Bitcoin Prices: BTC/USD BitFinex 4 Hours chart
 Cryptocurrency charts by TradingView. Technical analysis tools by Coinigy.
The post Bitcoin Price Analysis Oct.3: BitFinex Short Positions Are At 10-Day High appeared first on CryptoPotato.