Bitcoin Price Analysis Oct.23: a Temp Stability?
Following our recent BTC price analysis, Bitcoin is still “boring.” Traders are not used to this kind of stability that carries almost no trading volume at all. For the long-term, a stable Bitcoin is good for the mass adoption. Less for day traders.
Now what?
- The overall picture stays pretty much the same.
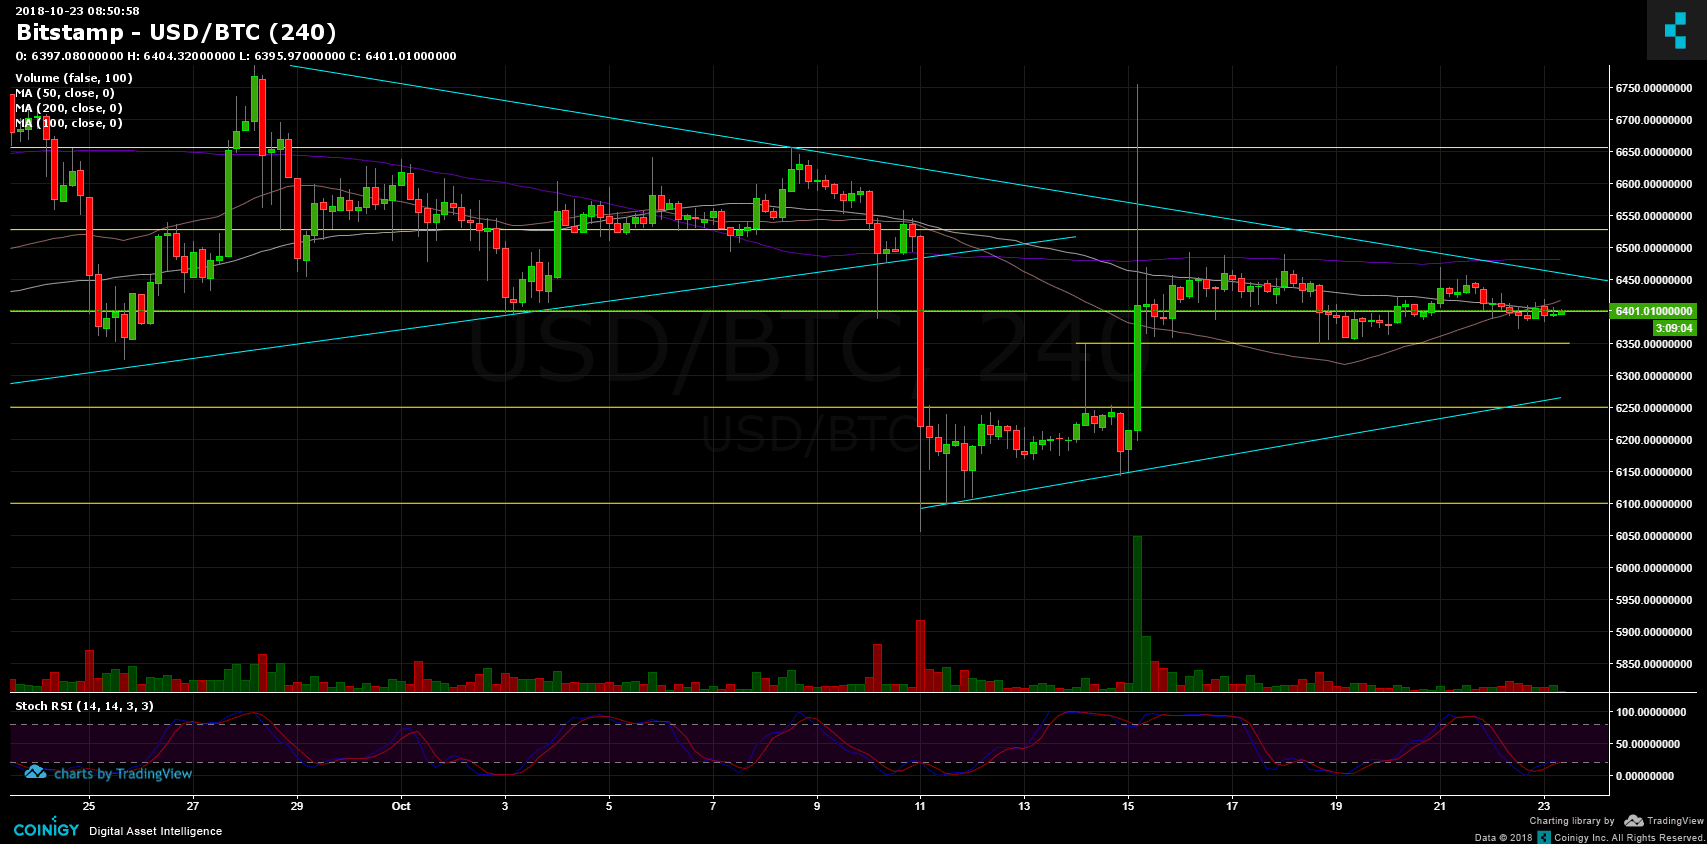
- Bollinger bands are getting tighter and tighter. I won’t be surprised to see a quick move, up or down, in the next 24-48 hours.
- Bitcoin is on top the $6400 support area, with little glitches to support at $6350. As of now, the three important moving average lines (200, 100 and 50 days MA) are above Bitcoin’s price.
- Bitcoin is around significant resistance area $6420 – $6530: the three moving average lines from above, along with descending trend-line.
- Support lies very close as well: $6350 – $6400, ascending trend-line around $6300.
- Zooming out of the tight range, the next significant support lies at $6250 and after is $6100. The next major resistance area is located around $6670 and $6800.
- The fact that there is no decision makes the last week’s trading very dull with not much action.
- BitFinex has 32K open short positions. This number has declined over the past days.
- RSI levels are close to their low levels; Market is oversold as of now.
- As a reminder: The market is still bearish. I would change my mind, if and only Bitcoin will create a higher-low and breaking above $6800.
BTC/USD BitStamp 4 Hours chart
 Cryptocurrency charts by TradingView. Technical analysis tools by Coinigy.
The post Bitcoin Price Analysis Oct.23: a Temp Stability? appeared first on CryptoPotato.


