Bitcoin Price Analysis Oct.21: Low volume, no action
Bitcoin is still hovering between $6300 – $6500 tight range. The trading volume is decreasing on a daily basis and is currently around the 2018 low numbers. When there is no volume, there is no action. However, let’s see what Bitcoin has been up to since our last price analysis.
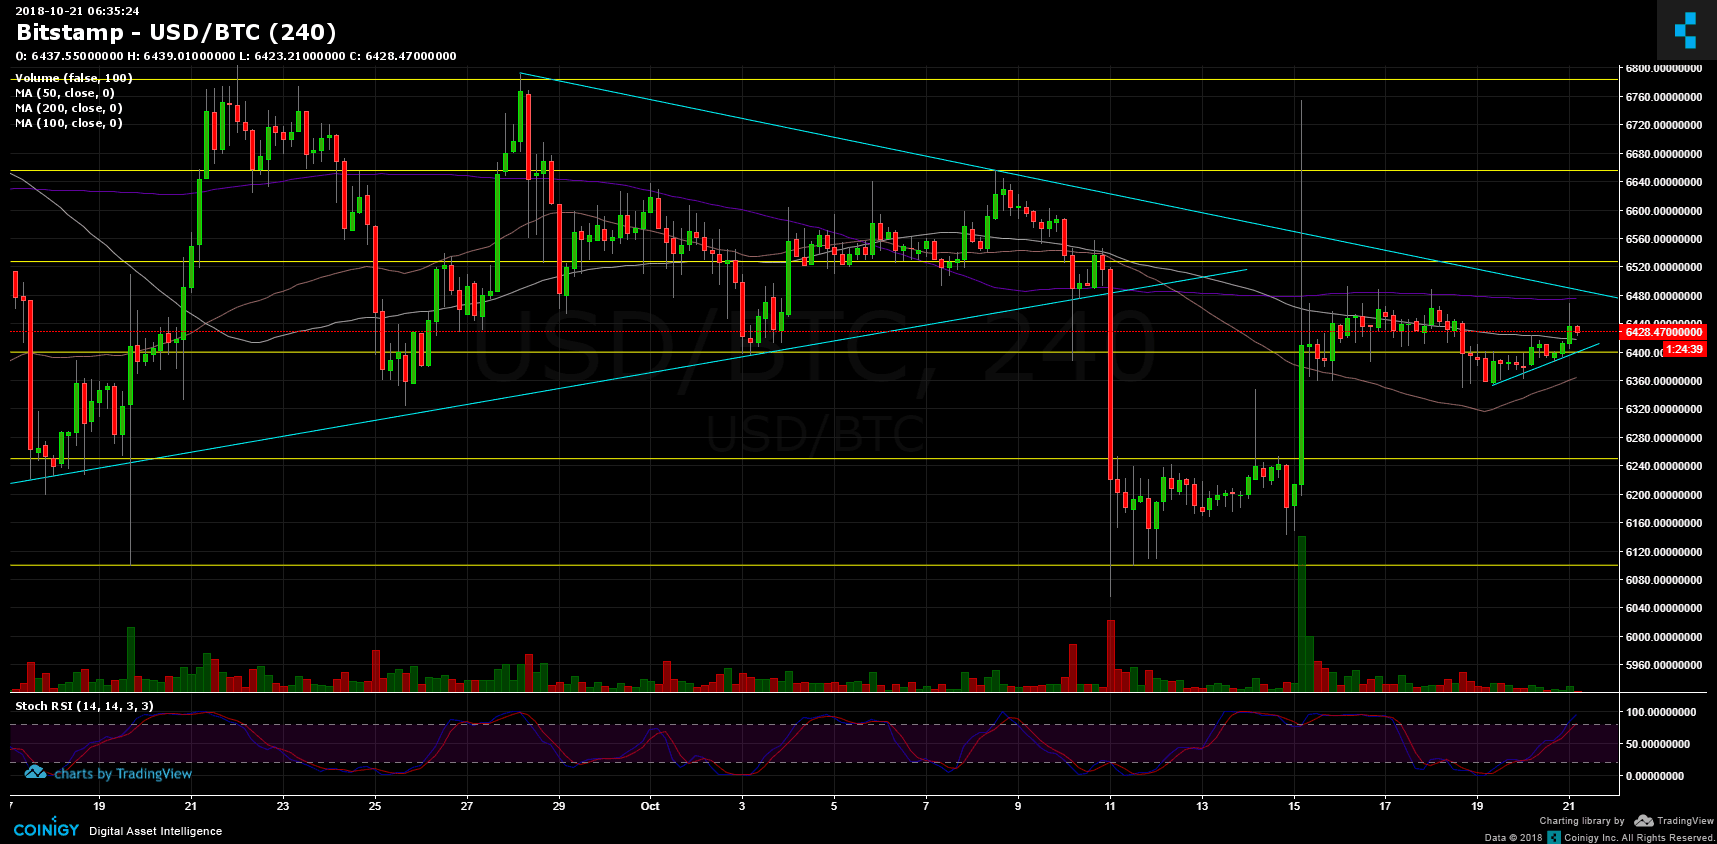
Now what?
- Bitcoin is testing a significant resistance area including the 200 Days Moving Average line (purple line on the chart), along with descending trend-line (currently around $6500) and resistance around $6530. Volume is the name of the game. A fake breakout could take place in this no-volume market.
- From the bear side: support levels lie around the 100 days Moving Average line (~$6420) along with support line at $6400, and 50 days Moving Average around $6350.
- Next significant support lies at $6250 and after is $6100.
- As we can tell, the above tight range and the face that there is no decision makes the last week’s trading very dull with no action.
- BitFinex has 33K open short positions. This number has declined over the past 3 days.
- RSI levels are close to their high levels; Market is overbought as of now.
- As a reminder: The market is still bearish. I would change my mind, if and only Bitcoin will create a higher-low and breaking above $6800.
BTC/USD BitStamp 4 Hours chart
 Cryptocurrency charts by TradingView. Technical analysis tools by Coinigy.
The post Bitcoin Price Analysis Oct.21: Low volume, no action appeared first on CryptoPotato.