Bitcoin Price Analysis Oct.2: Quiet Before the Storm?
Over the past year, it has been very rare that Bitcoin’s volatility is calm. It looks like Bitcoin’s range is getting tighten and tighten, till the triangle will breach out to either direction and produce a significant move.
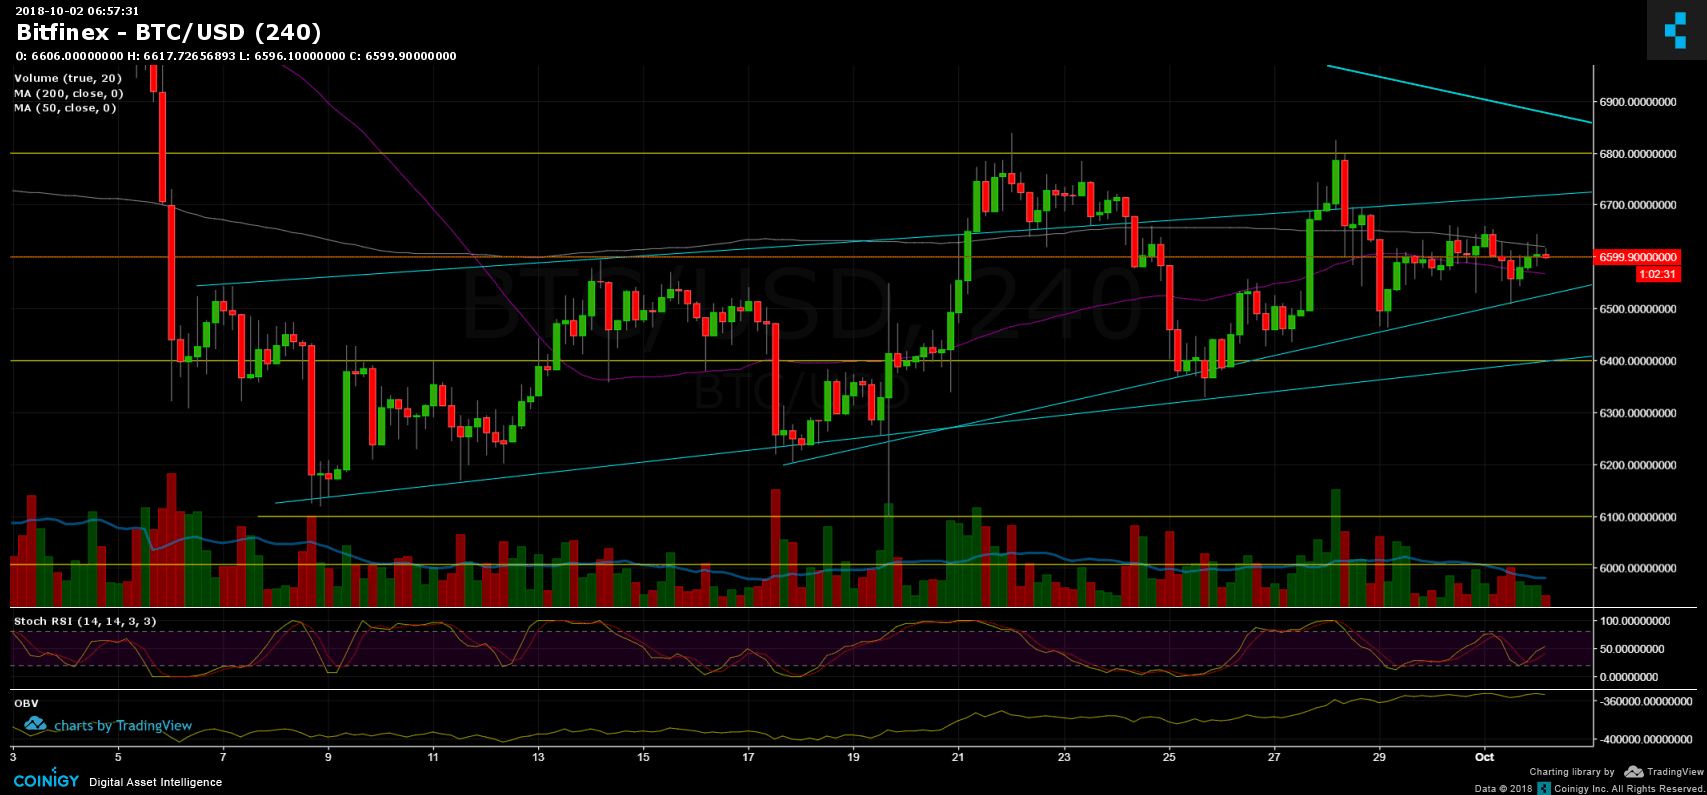
The movement is exactly between the two moving average lines that we are following: the 50 days (purple line on the chart below) and the 200 days (pink).
Now what?
- Bitcoin is forming a bullish triangle, which its top it located around resistance level at $6800 (double top and should be the long-term descending trend line marked on the chart below). Breaking it up will likely to send Bitcoin to re-test resistance levels at $7000 and $7300 (recent weekly high).
- From the bear side, breaking it down at around $6550 is likely to send Bitcoin to re-test support at $6400 and next major support is at $6100.
- As always: To declare an end to the long-term bear market, Bitcoin will need to create a higher low and break past $7300 (the last major high on the weekly chart).
- Bitcoin short positions on BitFinex had grown up over the past three days. A bearish sign?
- As of weekends and expectations of a major move – trading volume is relatively low over the past days.
Bitcoin Prices: BTC/USD BitFinex 4 Hours chart
 Cryptocurrency charts by TradingView. Technical analysis tools by Coinigy.
The post Bitcoin Price Analysis Oct.2: Quiet Before the Storm? appeared first on CryptoPotato.