Bitcoin Price Analysis Oct.18: Testing long-term resistance
Not a lot has happened since our previous price analysis; Bitcoin is still consolidating around the $6400 mark. It seems like a decision is soon to take place; whether breaking up the long-term descending line tough resistance or else – towards the $6000 – $6100 (again).
Now what?
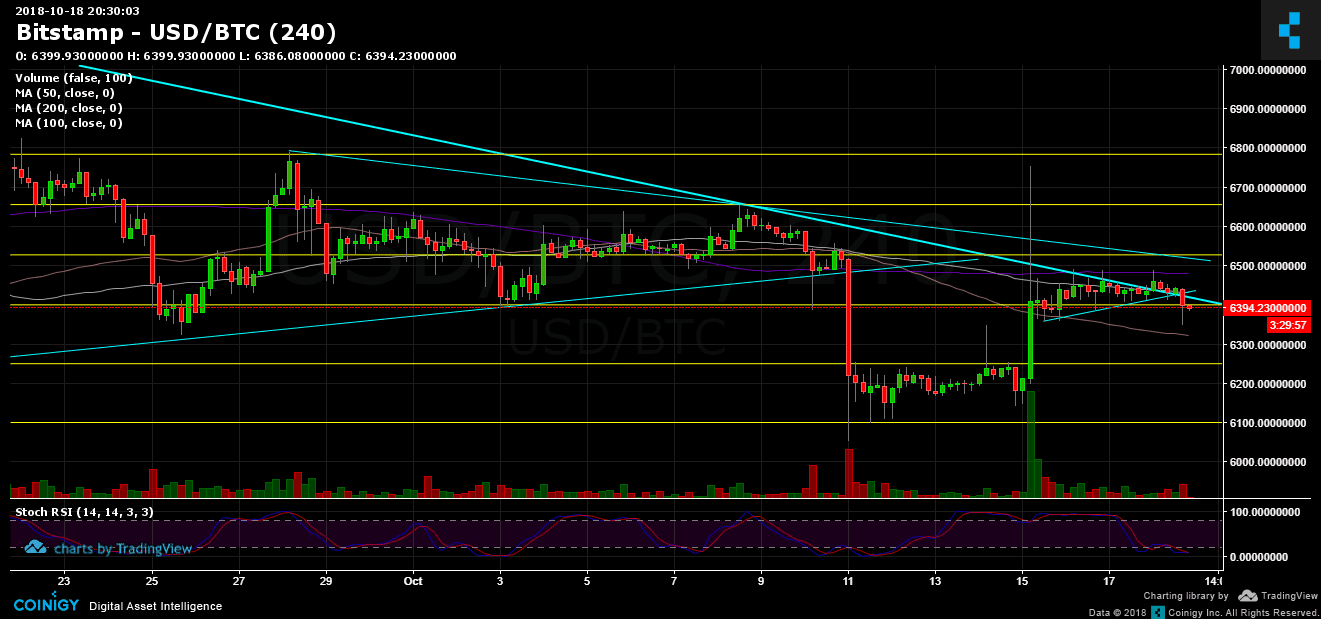
- Bitcoin is (still) testing the long-term descending trend-line, which started somewhere around March this year when Bitcoin’s price was about $11,700. This is a tough resistance area including the 200 and 100 days moving average lines (purple line represents the MA-200, white line represents MA-100). A possible break up could occur only followed by a decent amount of trading volume. As of now, the volume is pretty low.
- From below: support lies at current levels around $6400 (along with 50 days moving average line is now around $6320). Next support lies at $6250 and after is $6100.
- BitFinex short positions are continuing to accumulate. Getting close to the point before the Tether crash (followed by the short squeeze).
- RSI levels are at their LOW levels; Market is oversold as of now. This might give some hope to break up.
- As a reminder: The market is still bearish. I would change my mind, if and only Bitcoin will create a higher-low and breaking above $6800.
BTC/USD BitStamp 4 Hours chart
 Cryptocurrency charts by TradingView. Technical analysis tools by Coinigy.
The post Bitcoin Price Analysis Oct.18: Testing long-term resistance appeared first on CryptoPotato.