Bitcoin Price Analysis Oct.13: A temporary cease-fire?
Bitcoin was recovering from the severe $450 quick dump just two days ago. Seems like a temporary cease-fire. It’s either because of the weekend or any other reason. Not a lot happening, the range is very tight. The interesting thing to keep an eye on is the difference in BTC value between Bitfinex and the other exchanges. Let’s see what we expect from here:
Now what?
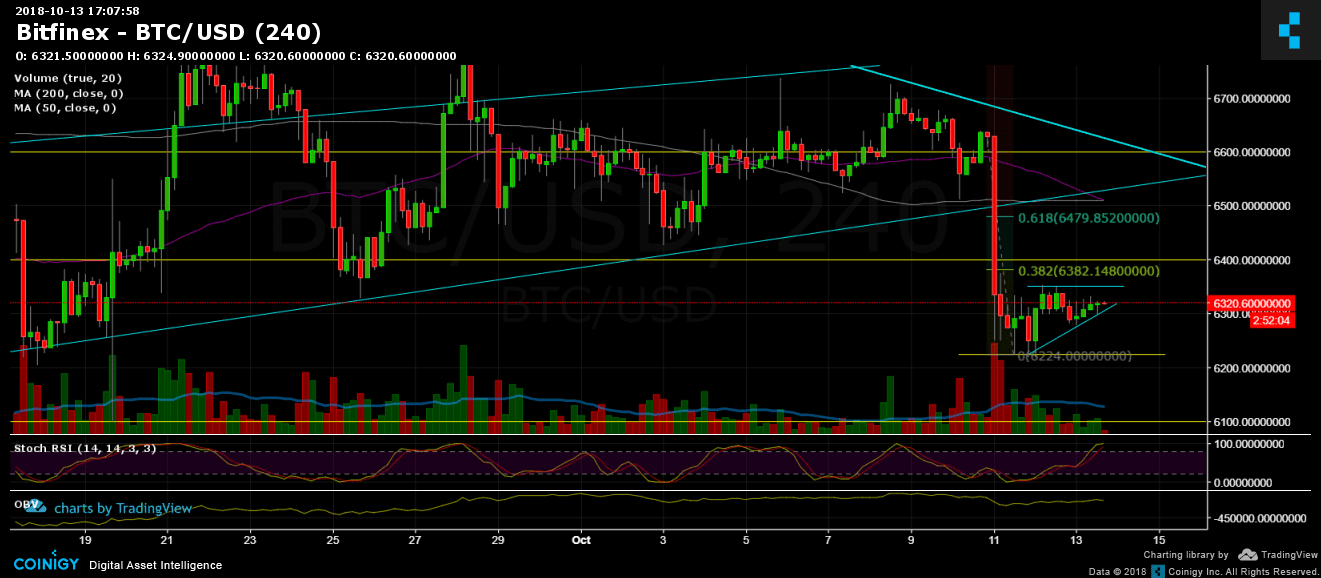
- On the hourly chart, there is a bullish triangle forming. Breaking about $6350 is likely to send Bitcoin to re-test resistance next levels around $6400 (where Fibonacci retracement 38.2% lies), and significant resistance around $6500 – 50 and 200 days moving average lines, along with ascending trend-line.
- Next support level lies around $6220 (weak) $6100 (strong) and $6000. Afterward, the 2018 yearly low at $5700 – $5800.
- BitFinex short positions are still accumulating, and their sum is only about 15% away from all-time high.
- RSI levels are at their high levels; Market is overbought as of now.
- Momentum is still bearish. I would start thinking about the market as bullish in a scenario of creating a higher-low and breaking above $6800.
BTC/USD BitFinex 4 Hours chart
 Cryptocurrency charts by TradingView. Technical analysis tools by Coinigy.
The post Bitcoin Price Analysis Oct.13: A temporary cease-fire? appeared first on CryptoPotato.