Bitcoin Price Analysis Nov.28: Will the $4K Break?
On our yesterday’s analysis, we mentioned the first bullish signs of buyers after a glitch to the yearly lows at $3500 the bulls got back to work: A steady gain and consolidation towards the significant descending trend-line, the one that was forming since the $5K area. The line finally breached a few hours ago.
The current 24 hours high lies around the $4050 resistance mark. Yes, this is the peak from two days ago which Bitcoin had failed to break-up and quickly turned down.
This is taken from yesterday’s analysis:
“The 4-hour chart emphasizes the lower lows. Bitcoin is forming, which is a bearish formation. This is shown on the following chart and colored in a light blue descending line. The first bullish sign I will be looking to see is breaking up that line, which was starting to form around the $5K area.”
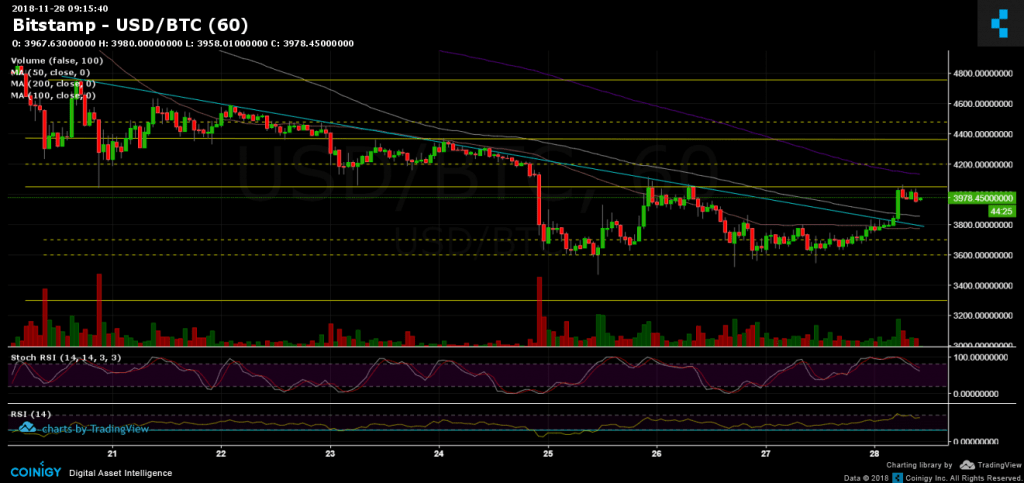
Looking at the 1-hour chart
- After breaking up the descending trend-line, the question is if this will turn into a deeper positive correction, maybe to re-test the $4500 – $5000 levels. However, first of all, the coin has to create a higher low and break the prior high at $4050.
- The breakout was followed by a decent amount of trading volume: Another bullish sign that might indicate that buyers had returned to work.
- From the bears’ side: Failing to break $4050 for the second time is likely to send BTC to prior support levels at $3850 and $3700. Below, lies the $3500 support area (which is the 2018 all-time low). Failing to hold that level will likely to send Bitcoin to the next support levels: $3300, $3200 and $3000.
- BitFinex’s open short positions have decreased to 34K, following the recent bullish action.
BTC/USD BitStamp 1-Hour chart
Cryptocurrency charts by TradingView. Technical analysis tools by Coinigy.
The post Bitcoin Price Analysis Nov.28: Will the $4K Break? appeared first on CryptoPotato.