Bitcoin Price Analysis Nov.25: The next big move is already here
Just hours ago, we anticipated a big move. As you all see, it did happen, unfortunate to the HODLers. Bitcoin created in a new yearly low at $3600 (as of writing this).
The move was sharp and violent. What we can tell about Bitcoin’s past 11 days, since breaking down the bearish triangle on November 14, is that the slope of the moves become more and more violent.
What does surprise me is the speed of the way down. When we recently published this prediction I didn’t expect Bitcoin to achieve that so quickly.
So what to do now? Hold or sell? This is very tough to answer. In my opinion (and only, and not advice), when we see such move in one direction, without any major correction, we can anticipate a deeper correction. Hence, I do expect somewhere around these levels to see a correction back to the support turned resistance levels.
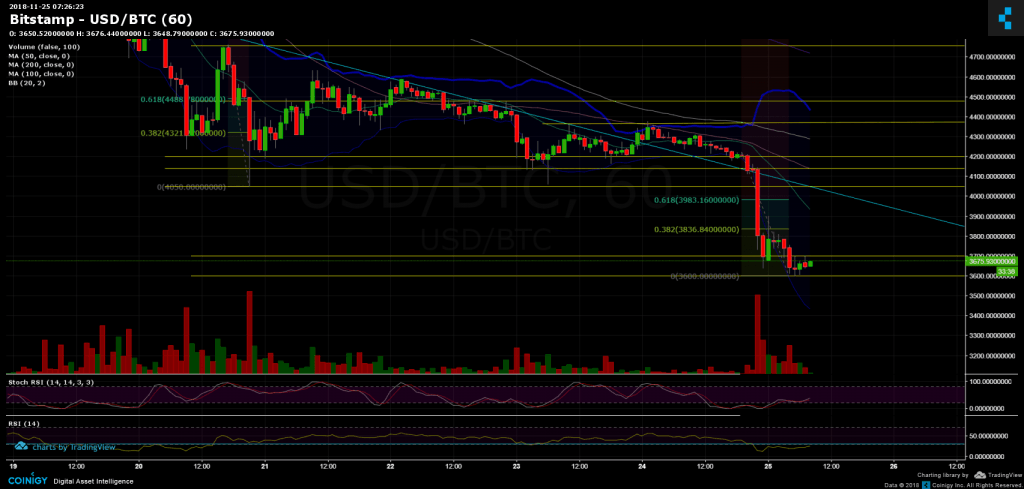
Looking at the 1-day chart & 1-hour chart:
- The double bottom on $4050 didn’t hold much. The bear scenario from yesterday’s analysis took place: Bitcoin broke the next major support on $3700 (that was reached within only two sad hours) in its way to the current low at $3600.
- As of writing this, Bitcoin is re-testing the $3700 but now from the other side, as a resistance level.
- Breaking the $3700 is likely to send Bitcoin to Fibonacci retracement levels: ~$3830 (38.2%) and ~$4000 (support-turned resistance along with Fib level 61.8%).
- From the bear side, support level at $3300 before reaching our predicted low at $2700 – $3000.
- Looking at the hourly chart, Stochastic RSI is about to cross in the oversold level. As of writing this, it hadn’t happened yet. RSI had crossed down the 30 mark, and after reaching a low of 12, RSI is back to re-test the 30 line from below.
- The trading volume has increased significantly, full of sellers.
- BitFinex open short positions are surging at 34.5K; this is their highest level since October 18.
BTC/USD BitStamp 1-Hour chart
Cryptocurrency charts by TradingView. Technical analysis tools by Coinigy.
The post Bitcoin Price Analysis Nov.25: The next big move is already here appeared first on CryptoPotato.