Bitcoin Price Analysis Nov.23: Black Friday in crypto. Time for the next target?
Yesterday we spotted the tightening Bollinger Bands forecasting a strong move, with no indication on the direction. I mentioned that unfortunately to the HODLers the move is likely to be to the negative side, according to the negative momentum.
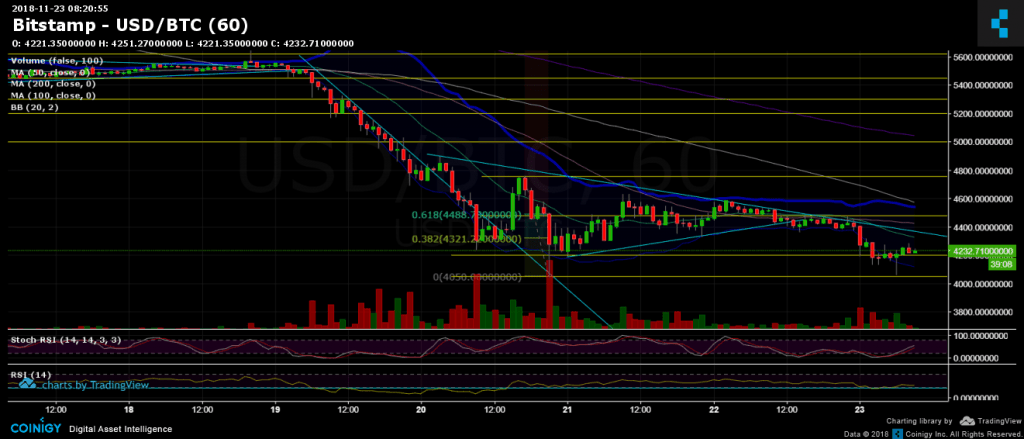
All of my feed is full of Black Friday sale. Cryptos also wanted to join the sales party. As of writing this, the tail of the hourly candle met the yearly low at $4050. It’s not a coincidence; this was the low from three days ago.
Looking at the 1-day chart & 1-hour chart:
- Bitcoin is back on top of the $4200 support. As of now, it seems very fragile, and it’s a matter of time until this support breaks again.
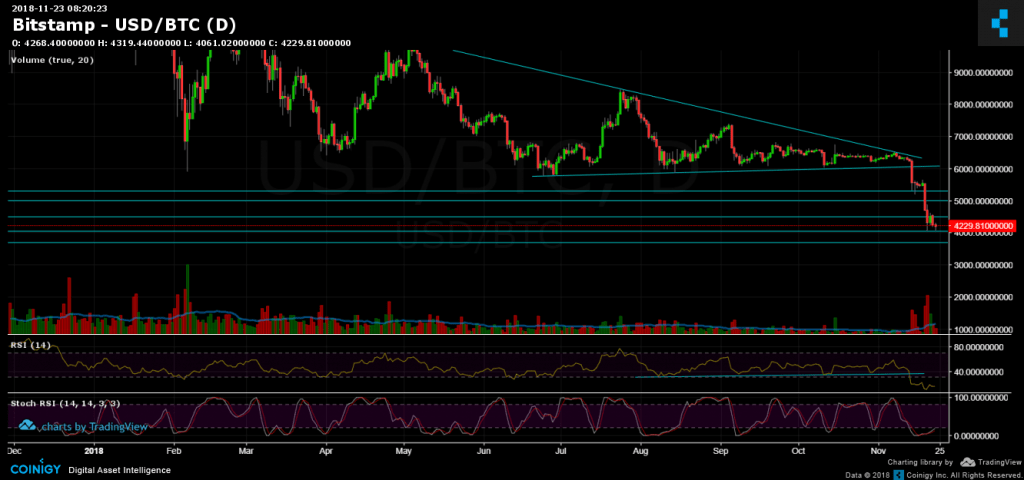
- The bullish scenario: A double bottom pattern is forming on top of the $4050 support level. This is a bullish formation, and we’ve seen the low for the next weeks. The next resistance levels are $4500, $4750 and $5000. This is a less likely scenario to my opinion.
- The bearish scenario: It’s a matter of hours, and the yearly low get broken. The next major support lies at $3700 area. The next significant support area lies at $3000.
- Looking at the daily chart, Stochastic RSI had crossed in the oversold level and is still on top. Is correction near? Will capitulation stage end soon?
- The trading volume has decreased, in anticipation for the next big move.
- BitFinex open short positions are at 28.5K, another decline from yesterday.
BTC/USD BitStamp 1-Hour chart

BTC/USD BitStamp 1-Day chart

Cryptocurrency charts by TradingView. Technical analysis tools by Coinigy.
The post Bitcoin Price Analysis Nov.23: Black Friday in crypto. Time for the next target? appeared first on CryptoPotato.


