Bitcoin Price Analysis Nov.22: Range tightens for a possible continuation move
Another had passed, this time we no discovered new low. Over the past day, Bitcoin’s range had tightened up and seemed like another wild move will take place later on today. I’m not quite sure to which direction.
From one side, the market is eager and deserves a correction back to the $5K+ area. But from the other hand, there is still a lot of panic selling, and Bitcoin has more to go lower.
Looking at the 1-day chart & 1-hour chart:
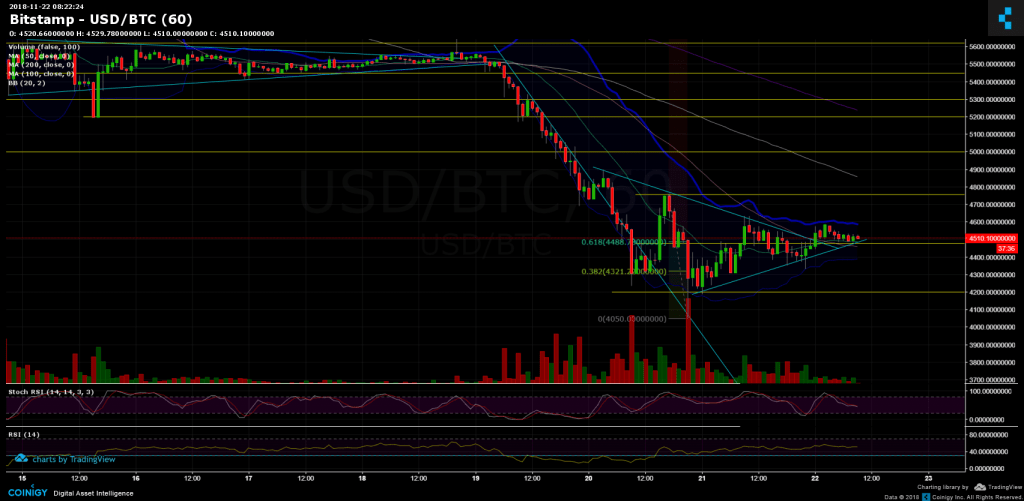
- For the past hours, Bitcoin is consolidating around the $4500 resistance turned support level. On top of the ascending trend-line along with the support line and the 50 days moving average line and Fibb retracement %61.8.
- Bollinger bands are getting tighter. When that happens, it might indicate on a coming-up move.
- This level is critic whether Bitcoin goes for a deeper correction or continue its way down.
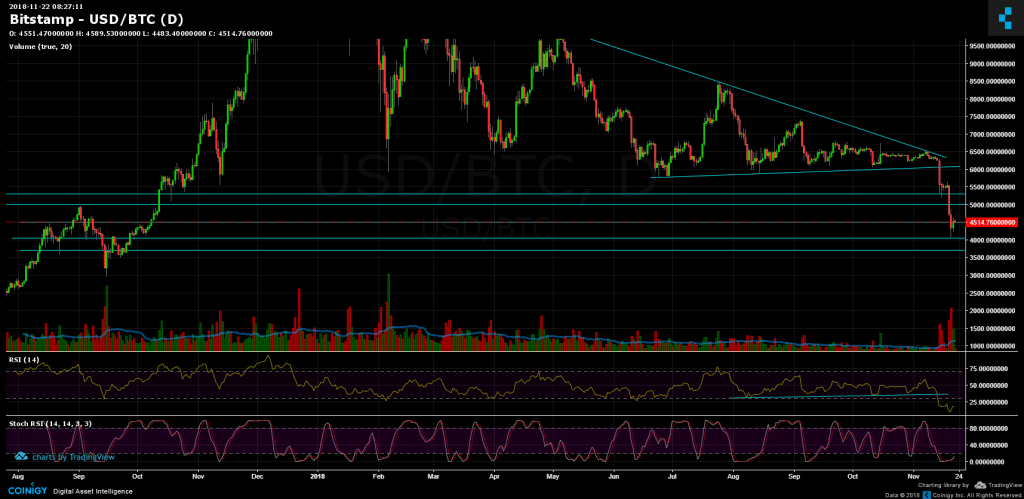
- From the bear side: $4500 is the current zone of support, the next major support lies at $4200, the yearly low at $4000 ($4050). Breaking the above, the next support lies at $3700 and $3000.
- From the bull side: In the event of surpassing the $4500 mark, the next resistance area lies at $4700 – $4750. Behind is the $5000 and $5300 support-turned resistance levels.
- In the daily chart, Stochastic RSI had crossed in the oversold level, which is the first sign of a possible deeper correction coming up soon.
- The trading volume has decreased, in anticipation for the next big move.
- BitFinex open short positions are at 30K, a slight decline from yesterday’s peak, but still considered high.
BTC/USD BitStamp 1-Hour chart

BTC/USD BitStamp 1-Day chart

Cryptocurrency charts by TradingView. Technical analysis tools by Coinigy.
The post Bitcoin Price Analysis Nov.22: Range tightens for a possible continuation move appeared first on CryptoPotato.


