Bitcoin Price Analysis Nov.21: Another low has been captured, what’s next?
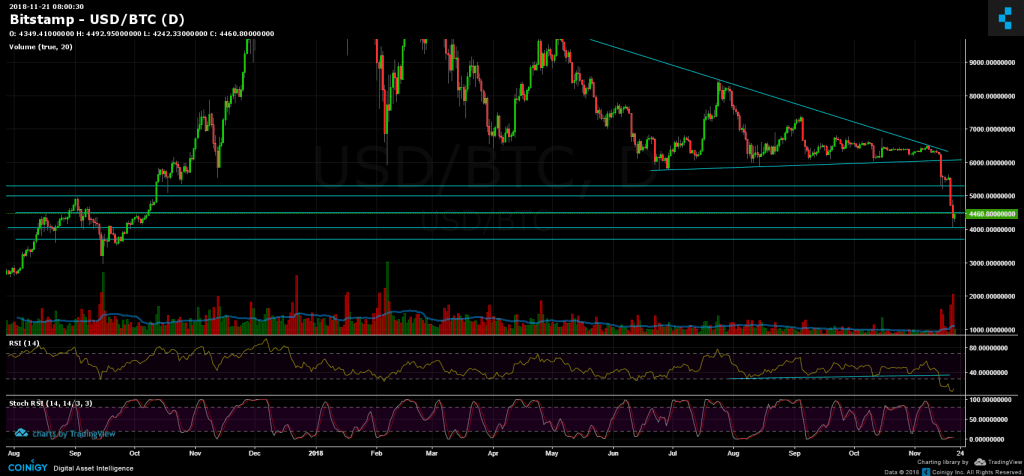
Unfortunate to all Bitcoin lovers, another low was captured. To whoever whose reading my BTC price analysis from yesterday, I stated there clearly that breaking the $4500 support level means that the next target is $4050. As seen by the following chart, Bitcoin’s yesterday’s low (actually the yearly low) is precisely at $4048.
Getting there, a slight correction has taken place. For the recent hours Bitcoin is consolidating between the $4200 – $4500 range.
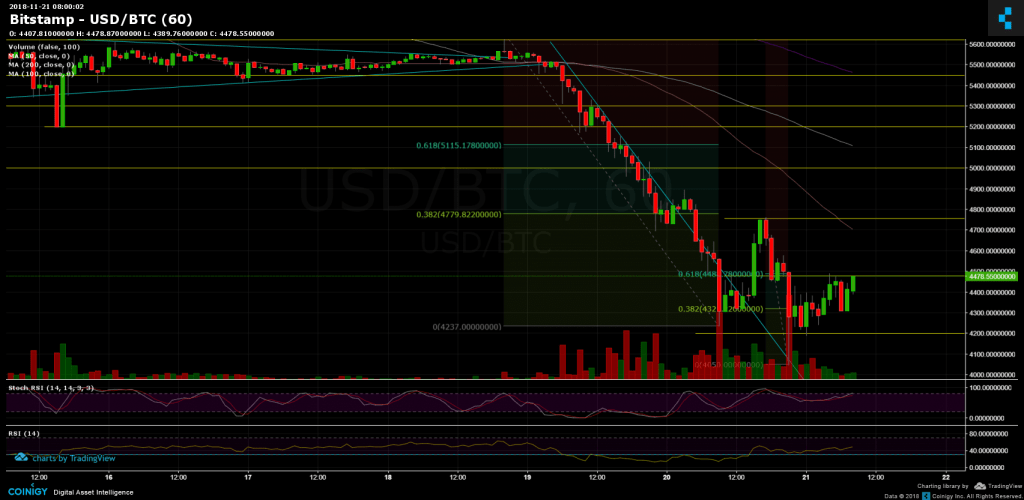
Interesting to notice is that Fibonacci retracement level %61.8 lies at $4488 which is the top boundary of the above range – which is significant resistance. Breaking $4500 support-turned resistance is the first key level for a more substantial correction than what we’ve seen so far.
The fibb level works: As you can also see, so far the downtrend from $5650 to $4250 was corrected exactly up to Fibb level %38.2 at $4750.
Looking at the 1-day chart & 1-hour chart:
- As mentioned, Bitcoin is trading for the past hours in the range of $4200 – $4500.
- From the bear side: After breaking $4500, the major support lies at $4000 ($4050). Breaking the above, the next support lies at $3700 and $3000 right after (which is 50% correction and the target to the prediction we published a week ago).
- From the bull side: In case of breaching the $4500 level, the next resistance area lies at $4700 – $4750. Behind is the $5000 and $5300 support-turned resistance levels.
- Stochastic RSI had crossed in the oversold level, which is the first sign of a possible deeper correction coming up soon.
- Possible zones for correction are all the support-turned-resistance levels of above. If a correction takes place, we should expect a sharp correction to the huge decline.
- The trading volume is (still) very high – sellers with their hands on.
- BitFinex open short positions gained more and currently at 31.1K, which is the new weekly high, and starting to be interesting for a possibility of a short squeeze.
BTC/USD BitStamp 1-Hour chart
BTC/USD BitStamp 1-Day chart
Cryptocurrency charts by TradingView. Technical analysis tools by Coinigy.
The post Bitcoin Price Analysis Nov.21: Another low has been captured, what’s next? appeared first on CryptoPotato.