Bitcoin Price Analysis Nov.20: HODLer’s nightmare, a chance for a correction?
A nightmare. No words can describe the past 24 hours of Bitcoin’s trading. For the first time, I had to switch to the Bitcoin’s daily chart since the 4-hour chart has no much space to show the $2000 decline over the past days.
The positive aspect is that Bitcoin is strong and survived even more severe declines:
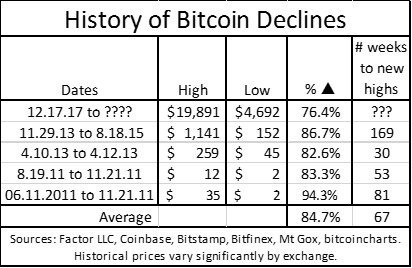
When we published our horror prediction, we didn’t think it will arrive so fast. But to my opinion, what comes quickly goes fast. As the way to $20K didn’t hold much and led a correction of 50%, then we should expect a correction up.
There are no words to describe what’s going on than a panic sell or capitulation which is the last stage of the market cycle.
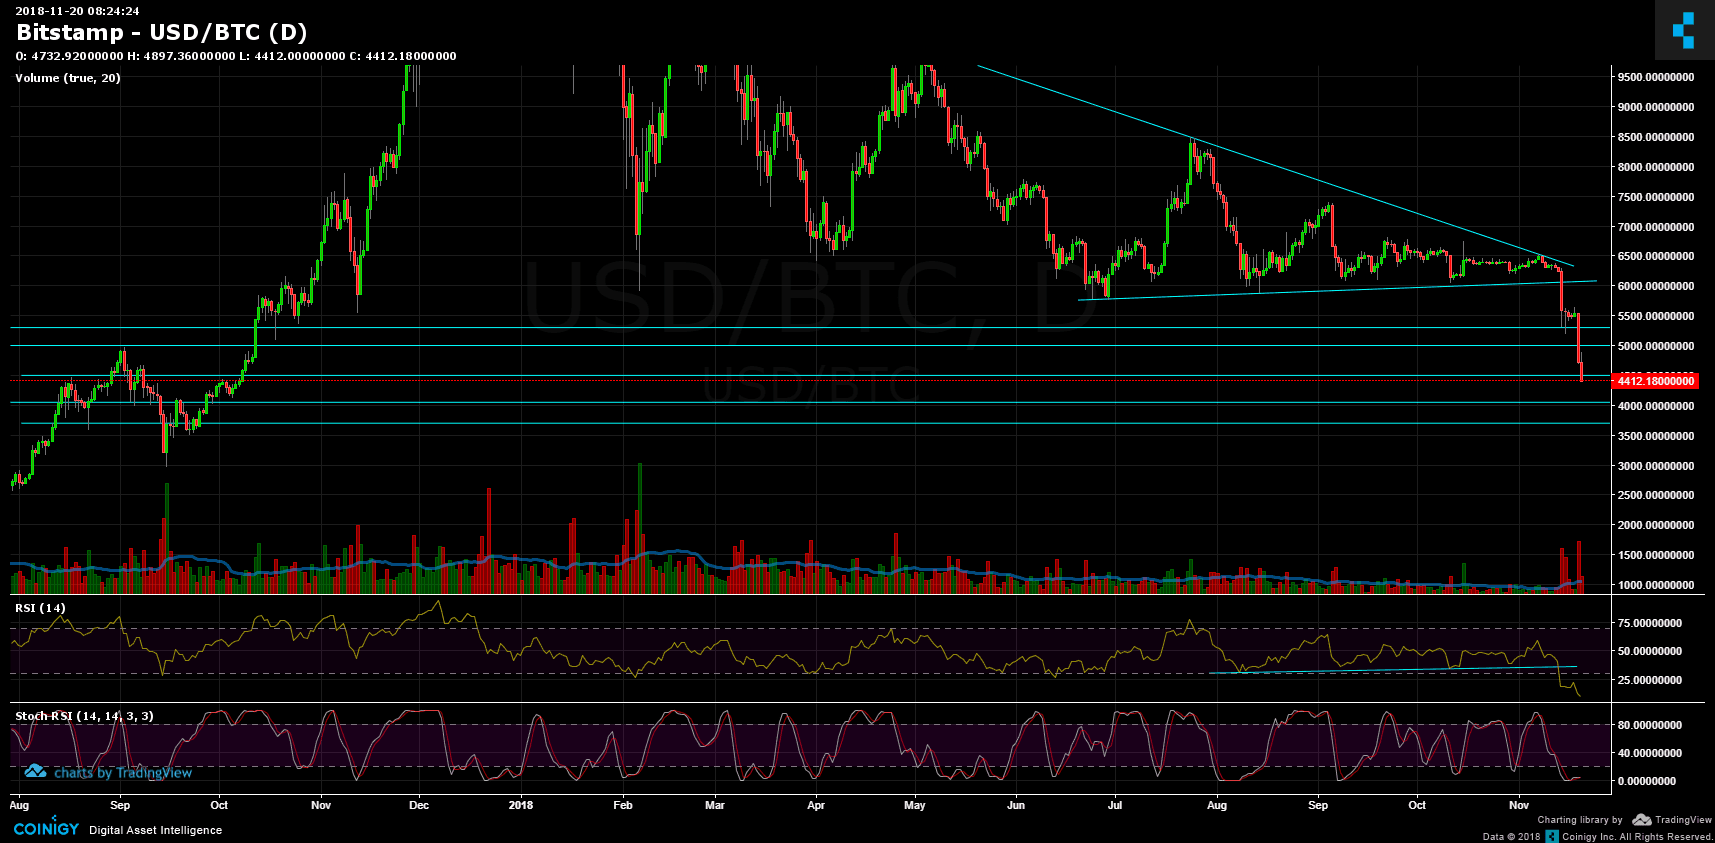
Looking at the 1-day chart:
- Bitcoin broke up the major support levels of $5300, $5000 and $4500. The next major support area lies near $4000 ($4050).
- Breaking the above, the next support lies at $3700 and $3000 right after (which is 50% correction and the target to the prediction we published a week ago).
- Hard to believe Bitcoin will complete all the above with no correction. The RSI level is at its lowest point in years. While Stochastic RSI had crossed in the oversold level, which is the first sign of a possible correction coming up.
- Possible zones for correction are all the support-turned-resistance levels of above. If a correction takes place, we should expect a sharp correction to the huge decline.
- The trading volume is very high and hadn’t been such since April 2018.
- BitFinex open short positions surged over the past hours to a current high of 28K, which is the new weekly high.
BTC/USD BitStamp 1-Day chart
Cryptocurrency charts by TradingView. Technical analysis tools by Coinigy.
The post Bitcoin Price Analysis Nov.20: HODLer’s nightmare, a chance for a correction? appeared first on CryptoPotato.