Bitcoin Price Analysis Nov.2: Testing resistance for a possible move up
On our previous analysis, we expected a Bitcoin move. Not long afterwards, Bitcoin broke the tight range it was traded at over the two weeks between October 15 and October 29. While the stock markets are going crazy, Bitcoin is the new “stable coin”.
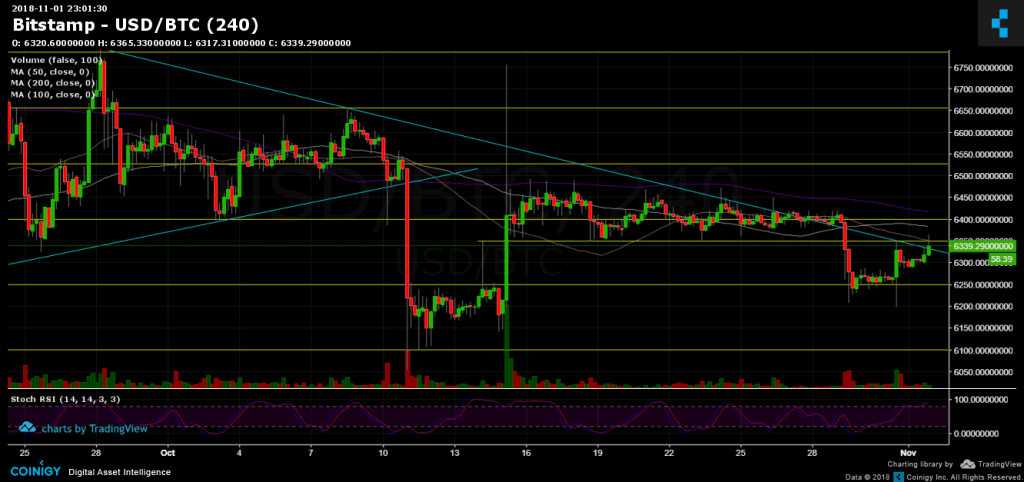
The move (down) broke the tight range with an immediate target of $6200 that was reached very quickly. Since then, Bitcoin made a slight correction up, while its volatility and trading volume decreased again.
Now What?
- Bitcoin is trying again to breach the descending trend-line (marked in light blue in the chart). This area ($6330 – $6430) serves as a tough resistance: $6350 resistance level along with the 50, 100 and 200 days moving average lines.
- Failing to break-up, and likely that Bitcoin will turn down to first re-test support level at $6250. The next support levels lie at $6100 and $6000.
- BitFinex has 28.9K BTC open short positions. The number had decreased a little over the past days. But, still boring as the Bitcoin recent months’ price action.
- Stochastic RSI is about to cross at its high levels. This might indicate on a correction down (the market is overbought).
- As a reminder: The market is still bearish. I would change my mind, if and only Bitcoin will create a higher-low and breaking above $6800.
BTC/USD BitStamp 4 Hours chart
 Cryptocurrency charts by TradingView. Technical analysis tools by Coinigy.
The post Bitcoin Price Analysis Nov.2: Testing resistance for a possible move up appeared first on CryptoPotato.


