Bitcoin Price Analysis Nov.19: Bleeding to $5K, or a double bottom?
Following the in-depth analysis from yesterday and as mentioned before, Bitcoin is under bearish conditions or at a stage known as Capitulation.
Capitulation sounds positive (as the last market cycle) even though it can take the asset to far new lows. We remind our long-term prediction.
From yesterday’s analysis: “Zoom in to the current’s situation: Bitcoin is forming a symmetric triangle which it’s getting tighter and expected to break. In my opinion, the higher the chance is a breakdown. The next support area lies around $5450 and $5300.”
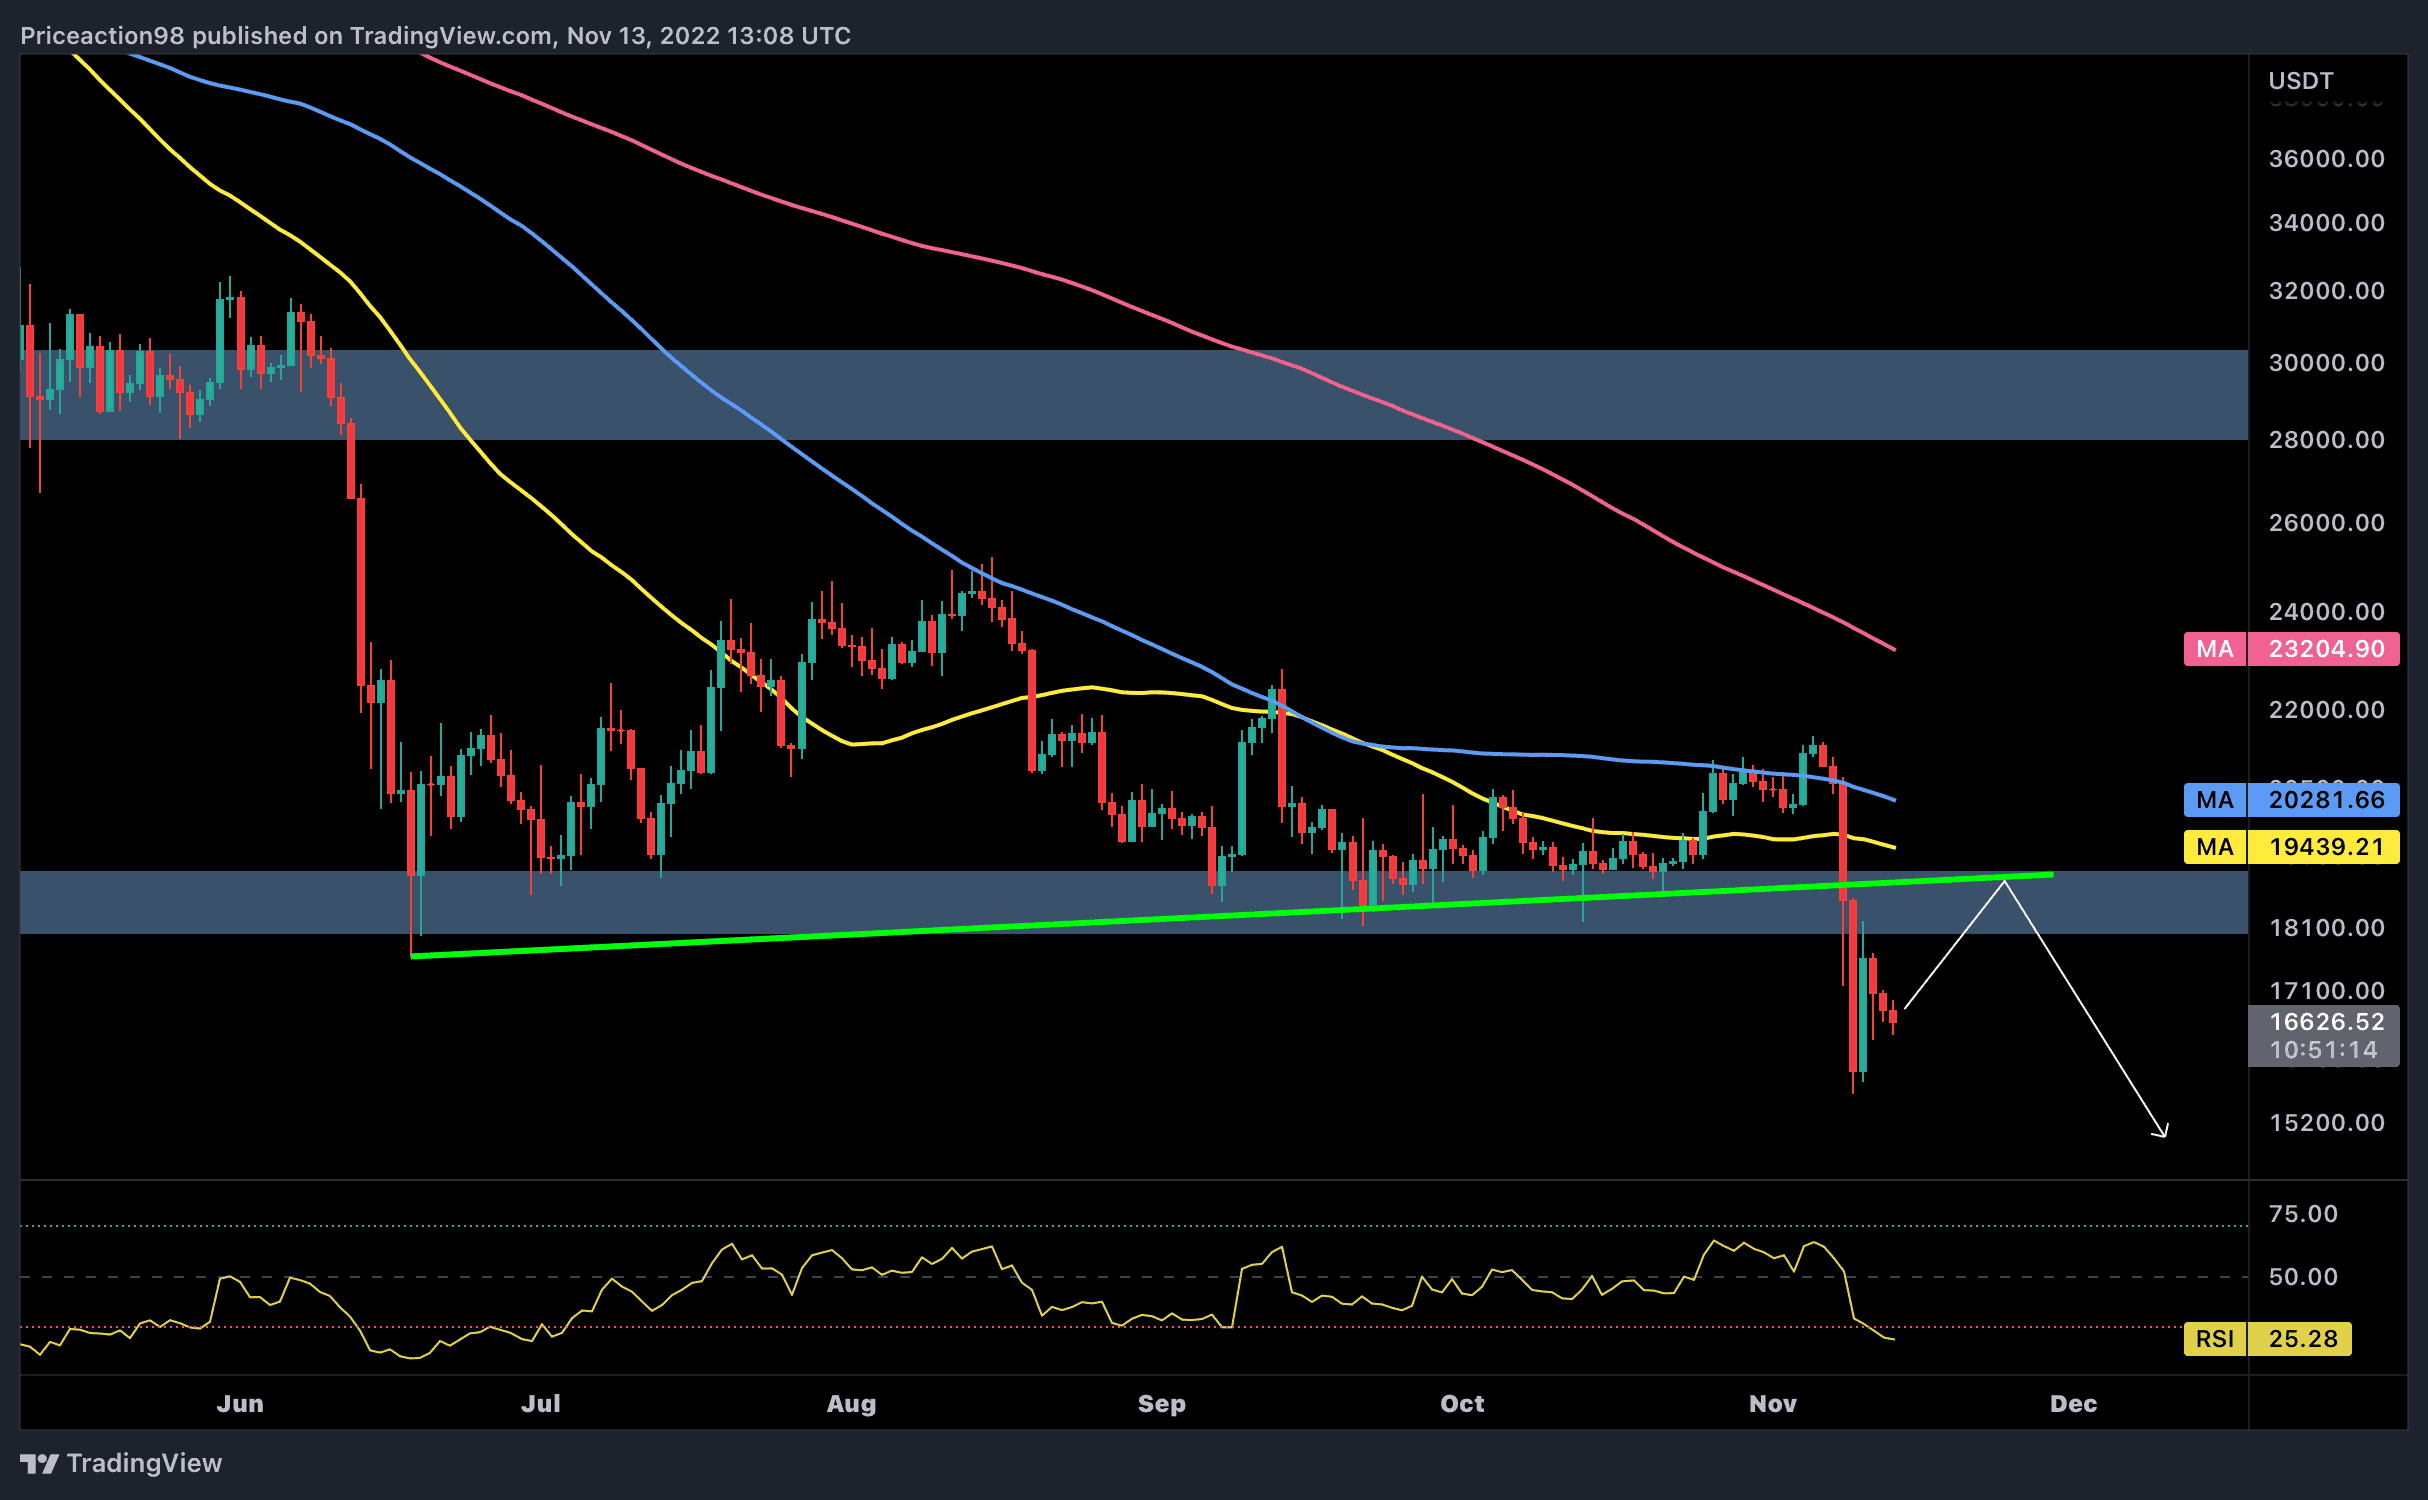
As we can see on the following chart, the triangle was broken down. The support level at $5300 has held for a bit, but then (during the recent hours and as I write this) another red candle came across to re-test the yearly low from November 15 at $5200 (Bitstamp).
Looking at the 4-hour chart:
- Looking at the larger time-frame, the Bitcoin daily chart: As mentioned before, the first target had been reached very quickly at $5300. The $5000 – $5300 might hold as possible support. Next possible support areas are $5000, $4500 and $3700. As we mentioned in the horror prediction – $2700 – $3000 is the possible bottom.
- Zoom in to the current’s situation: After breaking up the triangle, there are two options – the bullish one is that Bitcoin holds this current low of $5200 and forms a double bottom (a bullish form). The bearish, you can guess, is breaking down $5200 to test $5000 historic resistance.
- Resistance levels lie at $5300, $5450, ~$5650 (Fibonacci retracement level %38.2), and $5700 – $5800 area which is now support turned tough resistance. The next significant resistance lies at another support turned tough resistance – $6K.
- The RSI indicator: Another bearish sign comes from this indicator – RSI had crossed down the 30 level for the second time.
- Starting this week, the trading volume is back: High volume of sellers, which is a bearish sign.
- BitFinex open short positions jumped around 10% from yesterday to a current high of 24.5K. In their weekly high the number was 27.7K.
BTC/USD BitStamp 4-Hours chart

Cryptocurrency charts by TradingView. Technical analysis tools by Coinigy.
The post Bitcoin Price Analysis Nov.19: Bleeding to $5K, or a double bottom? appeared first on CryptoPotato.