Bitcoin Price Analysis May 2: BTC Retesting Crucial Resistance, Could It Turn Into a Bearish H&S?
Over the past two days, and following the breakout of the 4-hour descending trend-line, we see Bitcoin hovering between $5300 – $5350 over the past day or so. This is the marked resistance area from our previous analysis.
From here, in my opinion, there are two scenarios: the bearish is Bitcoin forming now the right shoulder of a head and shoulders pattern, whereas the head is ~$5600 and the baseline is ~$5000. Breaking down the last will execute the H&S formation with an expected target at around $4400.
However, the formation will be invalidated in case of breaking up the $5350 resistance area and creating a higher high, retesting and confirming the $5350 level as support.
Total Market Cap: $176.5 Billion
Bitcoin Market Cap: $96 Billion
BTC Dominance: 54.4%
Looking at the 1-day & 4-hour charts
– Support/Resistance:
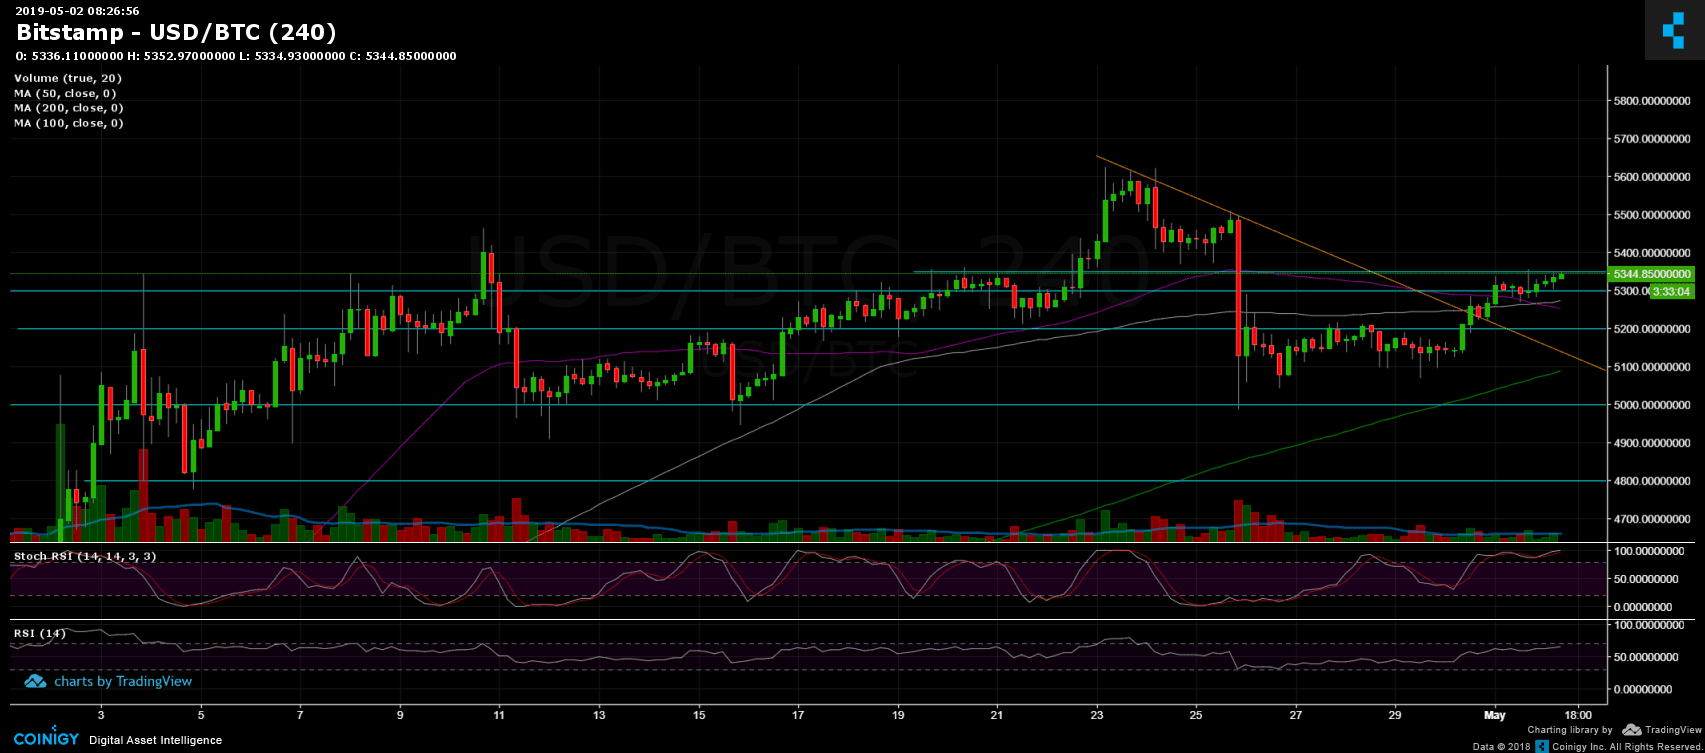
As mentioned above, Bitcoin is trading in a tighter range of $5300 – $5350, following the breakout of the 4-hour chart’s descending trend-line (marked in orange). In case of a breakout above that area, Bitcoin is expected to retest the next (weak) resistance level at $5400, before facing higher targets at $5500 and the 2019 high at $5625.
From below, the closest support lies at $5300, below lie the $5255 and $5200 support levels. Further below lies the significant $5000 support area. Also below is the $4700 – $4800 support zone, including the daily MA-50 line (marked in purple).
– Trading Volume: maybe because of the Holidays, or no interest, the past days’ trading volume is relatively week compared to April’s average volume.
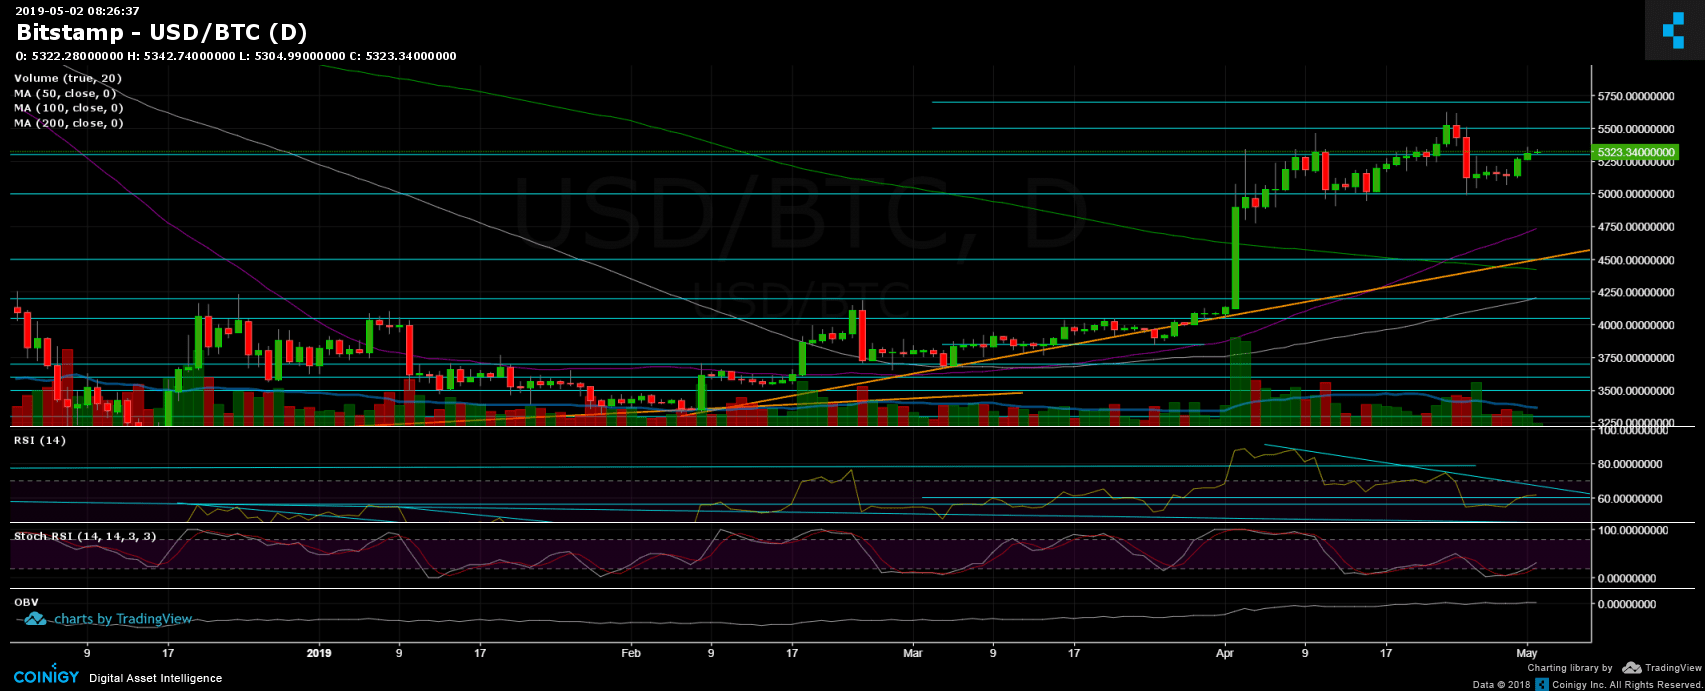
– Daily chart’s RSI: After breaking up the RSI level at 56 and 60, the RSI will be facing a resistance soon. However, keep in mind the negative divergence in the daily chart’s RSI, which could be a bearish sign.
– BitFinex open short positions: following a slight increase over the past two days, the number of short positions recorded its highest level since January 5, 2019, with 30.8K BTC open short positions.
BTC/USD BitStamp 4-Hour Chart
BTC/USD BitStamp 1-Day Chart
The post Bitcoin Price Analysis May 2: BTC Retesting Crucial Resistance, Could It Turn Into a Bearish H&S? appeared first on CryptoPotato.