Bitcoin Price Analysis March.24: Do or Die For Bitcoin As The Coin Struggles To Stay On-top The Ascending Line
In our most recent Bitcoin price analysis, we had mentioned the importance of the $4050 resistance. Three days ago the above level was retested and unfortunate to the bulls, the price got quickly rejected down.
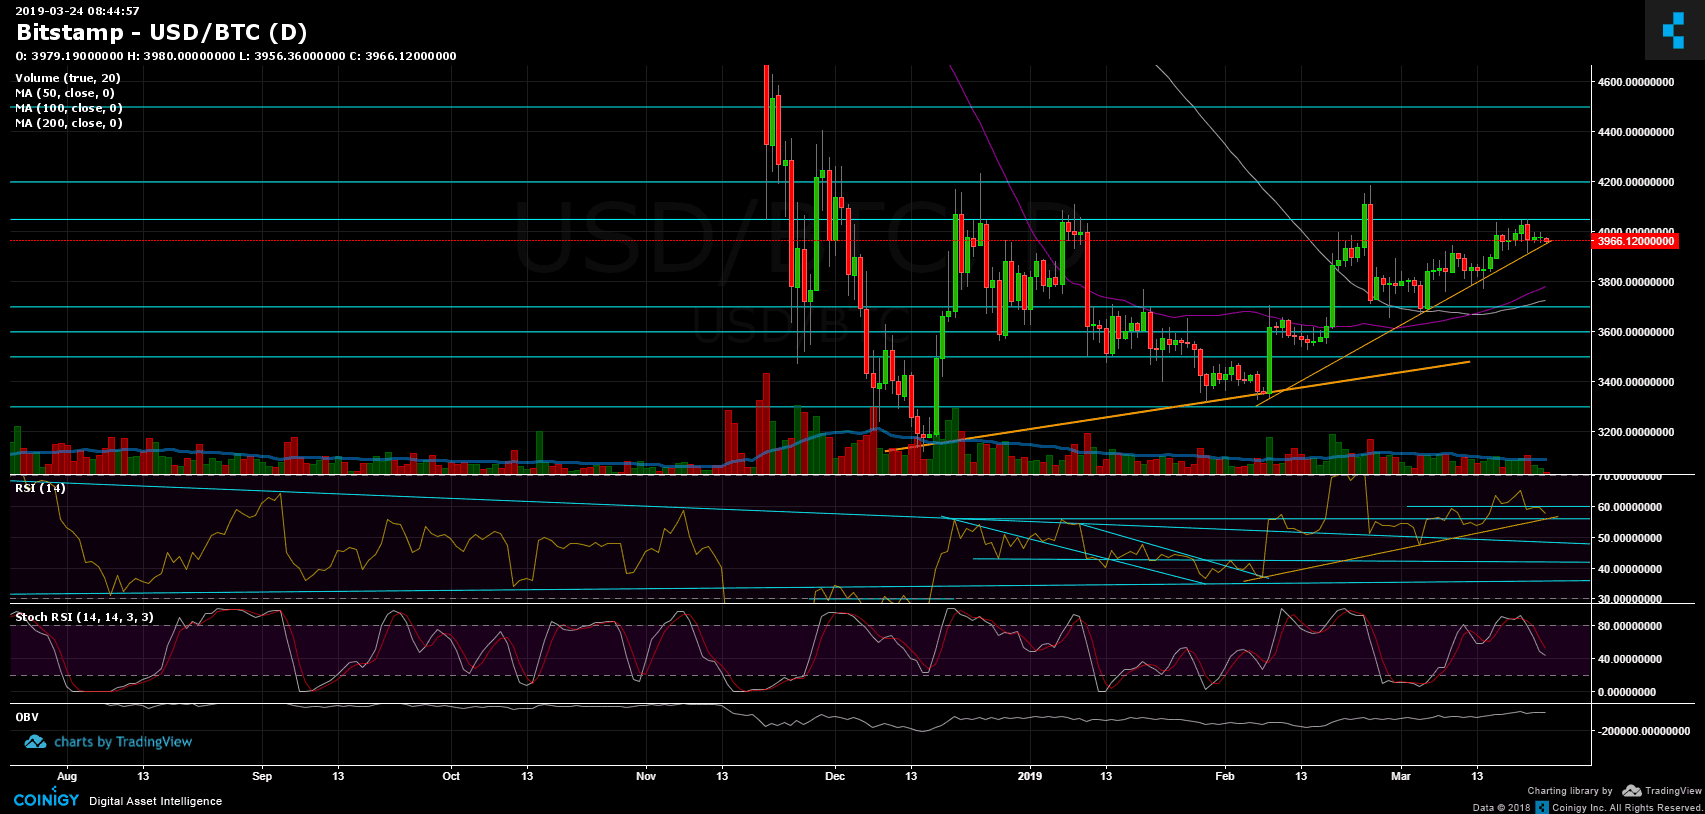
Looking on the BTC chart, we can see that the wick of the daily candle had tested the ascending trend-line which started forming since February 8.
The same ascending trend-line is now being tested for the fifth time (around the $3930 – $3950 support level).
Despite Bitcoin’s decline from the $4000 area, Altcoins are getting stronger, and the Bitcoin dominance is at its lowest point since August 2018.
Total Market Cap: $139.7 Billion
BTC Dominance: 50.6%
Looking at the 1-day & 4-hour charts
– Support/Resistance:
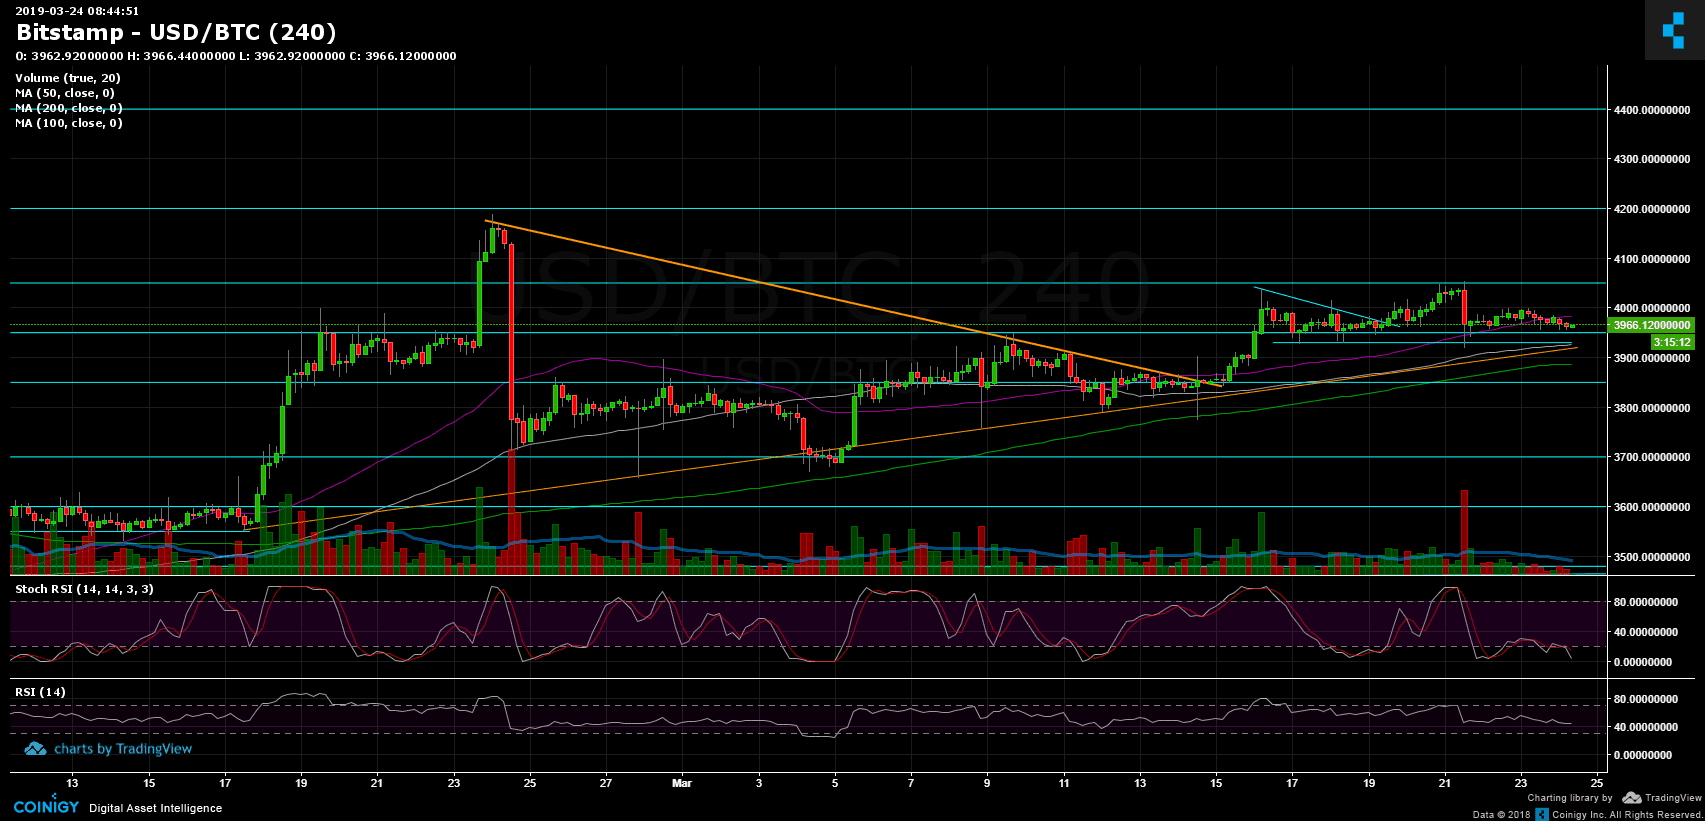
Bitcoin is facing the mid-term ascending support line at current price levels, along with support area at $3930 – $3950. In case of a break down, we should expect a retest of lower support areas of $3900 and $3850. Further support is located at the daily chart’s 50-days moving average line (currently around $3780), before reaching the $3700 support zone.
From above, the next resistance lies at $4000, before reaching the significant resistance level of $4050. If BTC finally breaks above the last, then we could expect a retest of the major $4200 level. Further above are the $4400 and $4500 levels before the daily chart’s 200-days moving average line (marked in light green), which as of now hovering lies around $4750.
– The daily chart’s RSI level: After breaking down and losing the 60 RSI level, Bitcoin is getting close to retest the 56 RSI level along with the ascending trend-line (marked in orange).
– The daily trading volume: Following our recent analysis, the last move up had a lack of volume. This lack continues up now. Probably the whales are preparing their next major move.
– BitFinex open short positions: The short positions have decreased to 20.3K BTC open positions.
BTC/USD BitStamp 4-Hour Chart

BTC/USD BitStamp 1-Day Chart

The post Bitcoin Price Analysis March.24: Do or Die For Bitcoin As The Coin Struggles To Stay On-top The Ascending Line appeared first on CryptoPotato.


