Bitcoin Price Analysis Mar.19: Bitcoin Will Try To Avoid The Mini Bearish Triangle Consolidating Around $3950
Since getting rejected from the $4050 resistance level and for the past three days, Bitcoin had been consolidating around the $3950 mark.
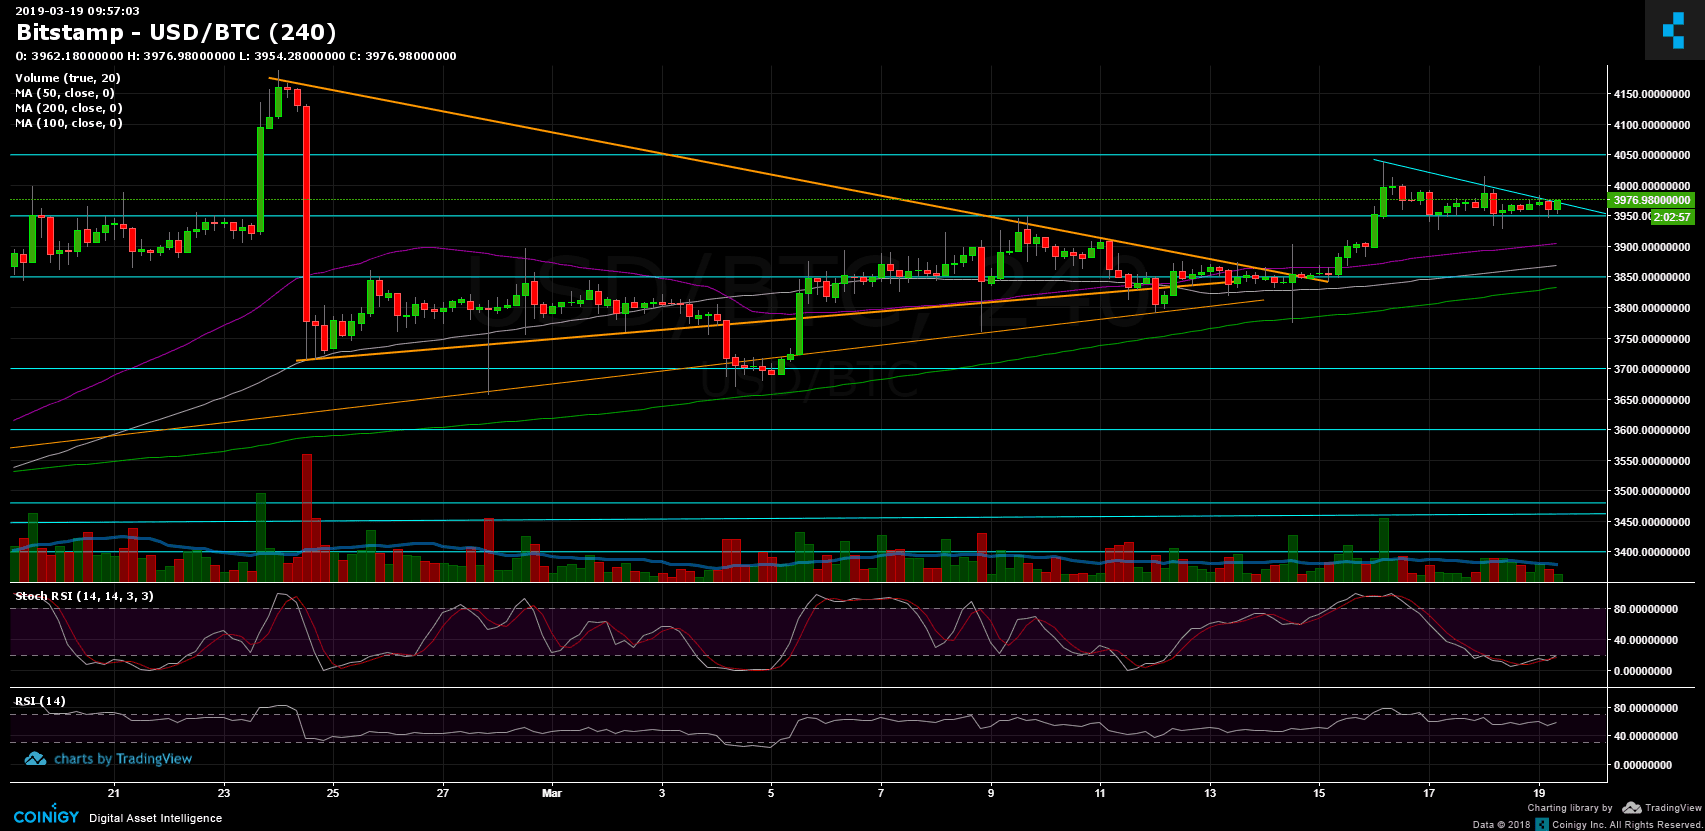
On the 4-hour chart we can see that Bitcoin is forming a bearish triangle with apex to be reached in the next hours: Breaking down the $3930 – $3950 and it’s likely to see Bitcoin coming down to retest prior support levels at $3850 and $3800. A less likely break-up (at the moment) could trigger a retest of the $4050 resistance.
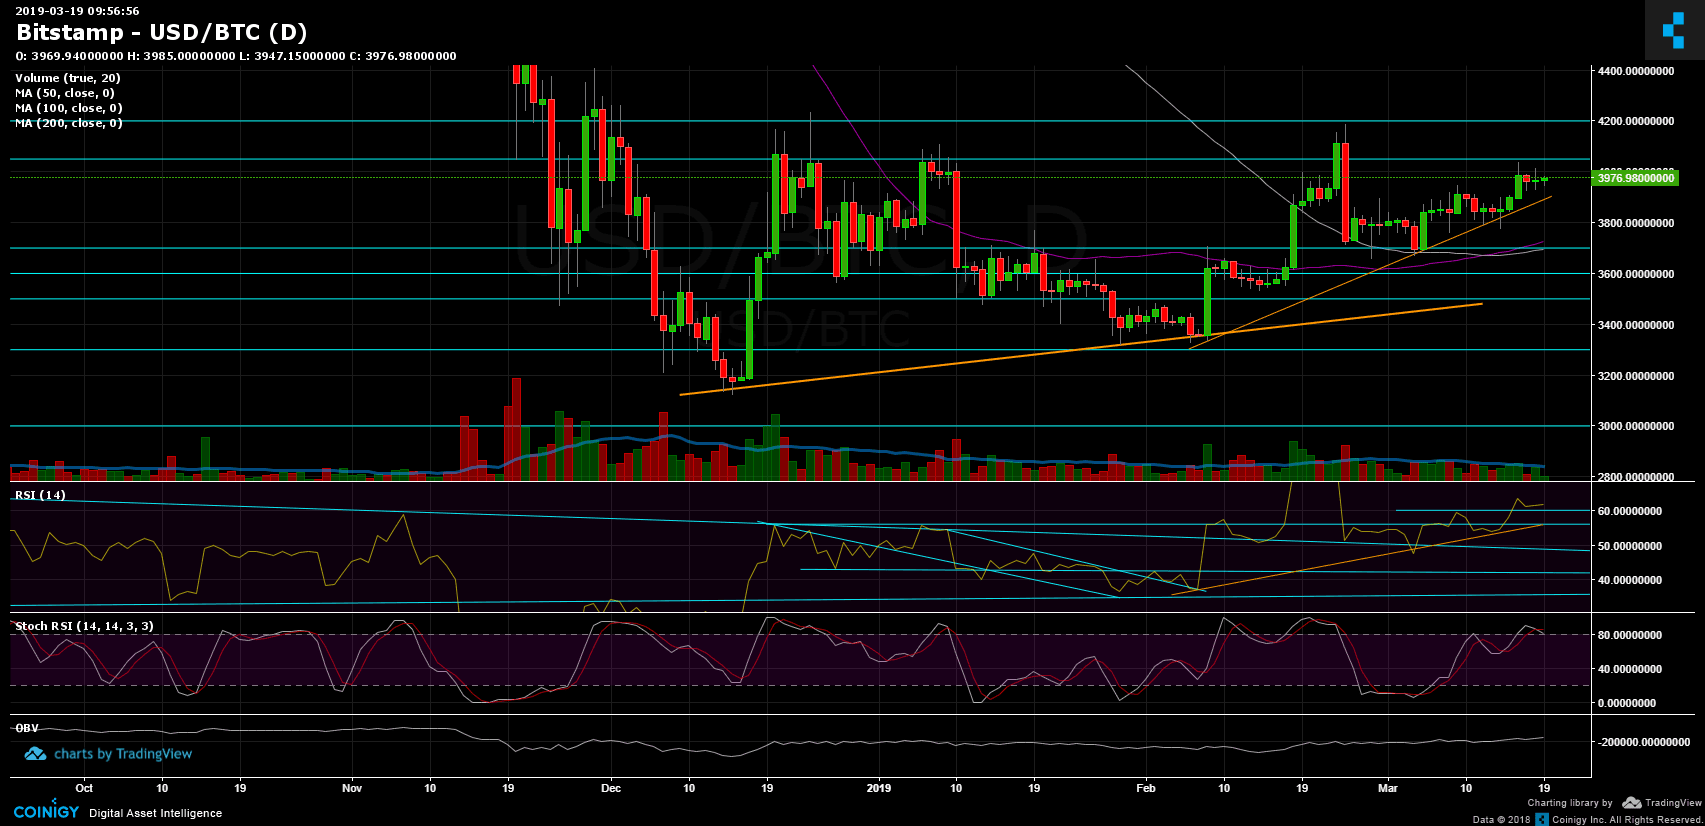
Another sign could be coming from the Stochastic RSI oscillator. On the daily chart, the oscillator had recently crossed over pointing down, around the overbought area.
Overall, the market, including BTC and the Altcoins, is on a “stand-by” mode, looking for its next direction, which should be triggered soon.
Total Market Cap: $139.9 Billion
BTC Dominance: 50.8%
Looking at the 1-day & 4-hour charts
– Support/Resistance: As mentioned above, the closest support is the resistance-turned-support level at $3930 – $3950, beneath are the $3850 and $3800 support areas, before reaching the $3670 – $3700 zone which includes the 50 and 100 days moving average lines (daily chart).
From above, Bitcoin has to break up the descending trend-line of the mentioned bearish triangle (on the 4-hour chart). Afterward, resistance is located at $4050, while breaking up is likely to send BTC to retest the $4200 resistance.
– The daily chart’s RSI level: The 60 RSI level is now being tested as support. This could be crucial if the RSI can lift from here or break down, what can trigger the next BTC move.
– The daily trading volume: The volume is around the monthly average, not significant, however a bullish sign could be coming by looking on the candles, as we can identify higher green candles than red ones. Did somebody say quiet accumulation?
– BitFinex open short positions: The short positions have increased to 22.5K BTC open positions.
BTC/USD BitStamp 4-Hour Chart
BTC/USD BitStamp 1-Day Chart
The post Bitcoin Price Analysis Mar.19: Bitcoin Will Try To Avoid The Mini Bearish Triangle Consolidating Around $3950 appeared first on CryptoPotato.