Bitcoin Price Analysis Jan.7: BTC Is Over $4000 Following Triangle’s Breakout
On our previous BTC price analysis from two days ago, we mentioned the sideways action along with the anticipated move:
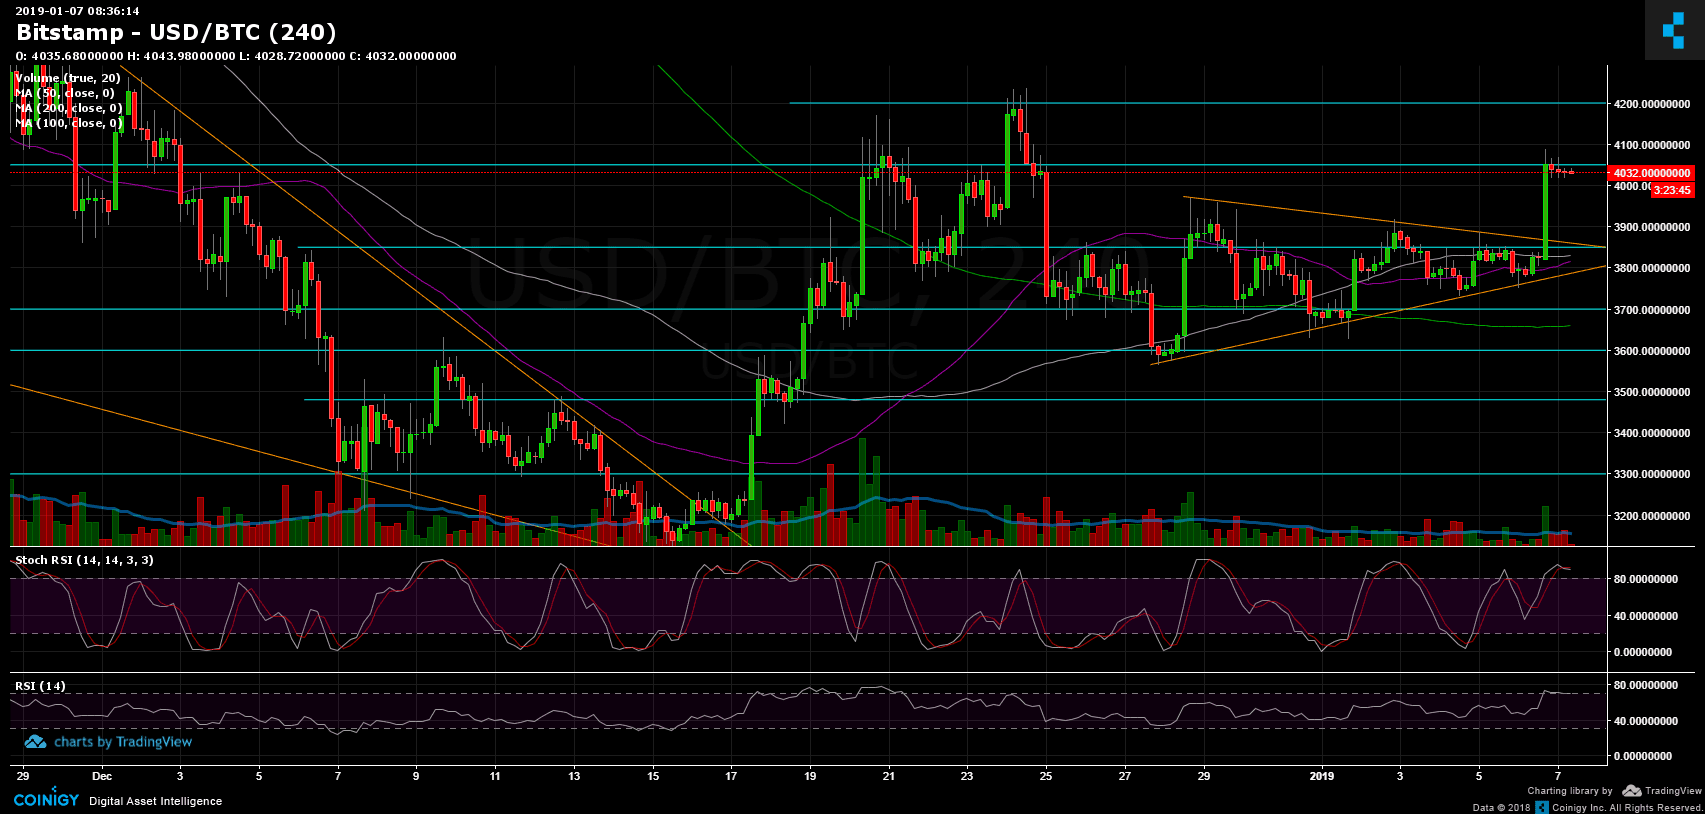
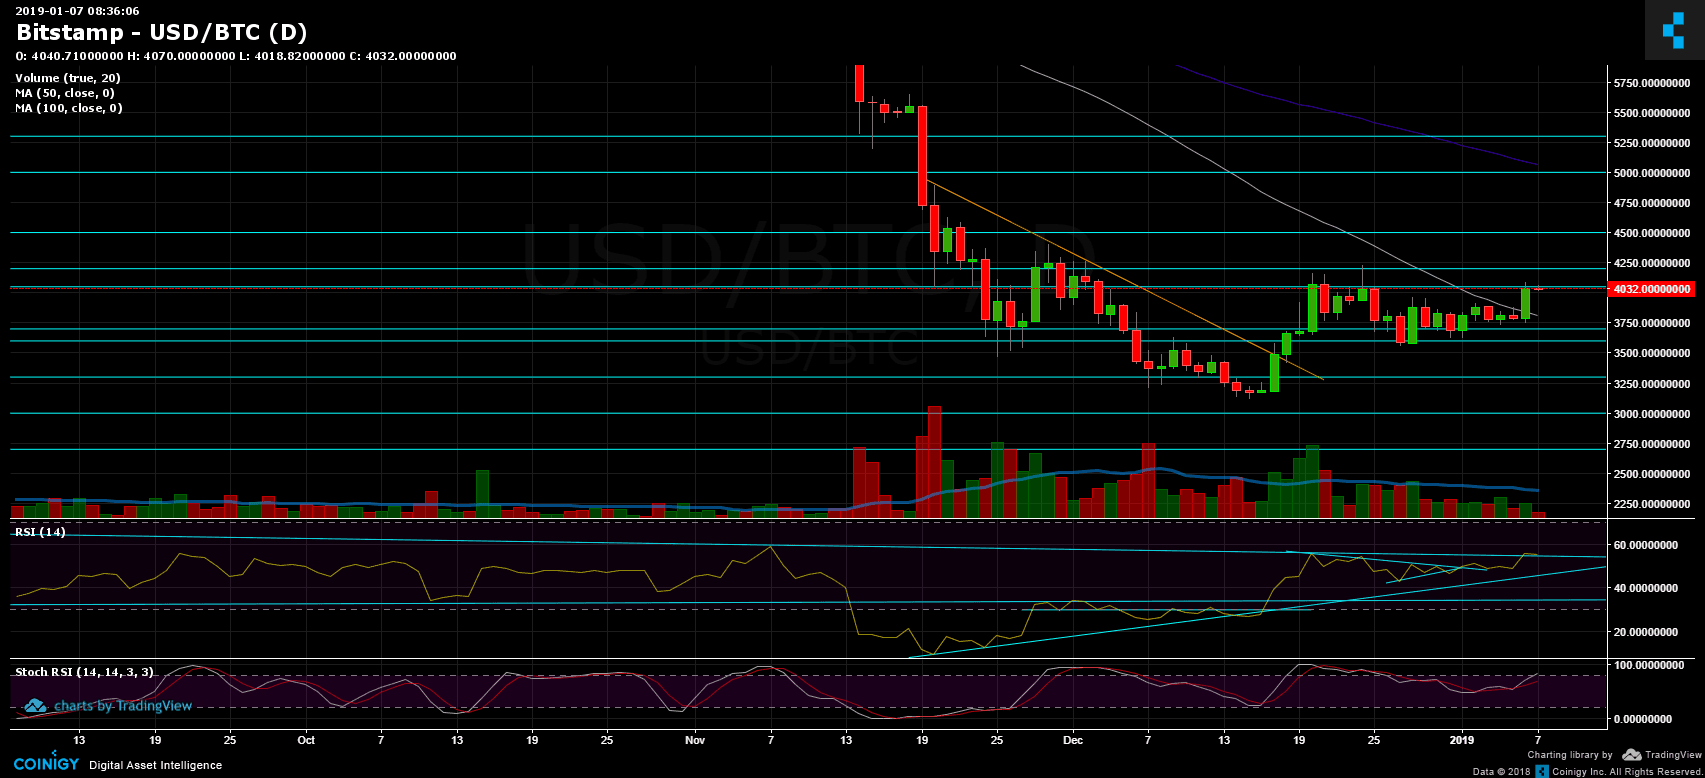
“The triangle should be decided along with the interaction with the significant resistance level of the 50-days moving average line from the daily chart (marked in white).
A breakout could turn out to be a very bullish move and send Bitcoin to retest next resistance levels around the $4050 – $4200 area. The following resistance level is $4400.”
As we can see, the described scenario took place, with Bitcoin reaching a 24-hours high of $4090 (Bitstamp) as of now, following a decent breakout of the symmetric triangle along with the 50-days moving average line (from the 1-day chart).
Looking at the 1-day & 4-hour charts
- Bitcoin is now facing the $4050 well-known resistance level. We could expect the bulls to push the price even higher, to the next resistance level at $4200. Following the above, the further resistance area is $4400 – $4500.
- The bullish inverse Head and Shoulders pattern is still alive: we can expect a play-out of it in case of breaking up the $4200 area with a reasonable amount of volume. The iH&S formation could grant Bitcoin immediate targets of over $5000.
- However, following the triangle breakout, Bitcoin might need some air to continue higher, and Stochastic RSI indicator confirms it as it had crossed over in the overbought area.
- Possible support levels for correction could be $4000, $3950 and $3900. Reaching those levels will be considered as a healthy correction. The next major area of support is the $3800 – $3850 area (including 4-hour 100 and 50 days moving average lines).
- Daily Chart: The RSI level had reached the long-term descending trend-line, which could be a resistance area (this straightens the above point of a needed correction).
- What I don’t like about the recent breakout is the relatively low amount of trading volume. This could be because of the weekend, but for a possible bullish continuation, we should see a rise in the volume of buyers.
- Following our shorts report from yesterday, BitFinex’s open short positions, decreased to their lowest point since November – 24.7K BTC, while BTC long positions are still showing nice gains. BitFinex is soon going offline for servers migration, which could trigger some price action for the next hours.
BTC/USD BitStamp 4-Hour chart

BTC/USD BitStamp 1-Day chart

The post Bitcoin Price Analysis Jan.7: BTC Is Over $4000 Following Triangle’s Breakout appeared first on CryptoPotato.


