Bitcoin Price Analysis Jan.30: BTC Is Back Above $3400. Would That Hold?
After the declines of the past days, BTC had gone through some consolidation around the $3400 support level.
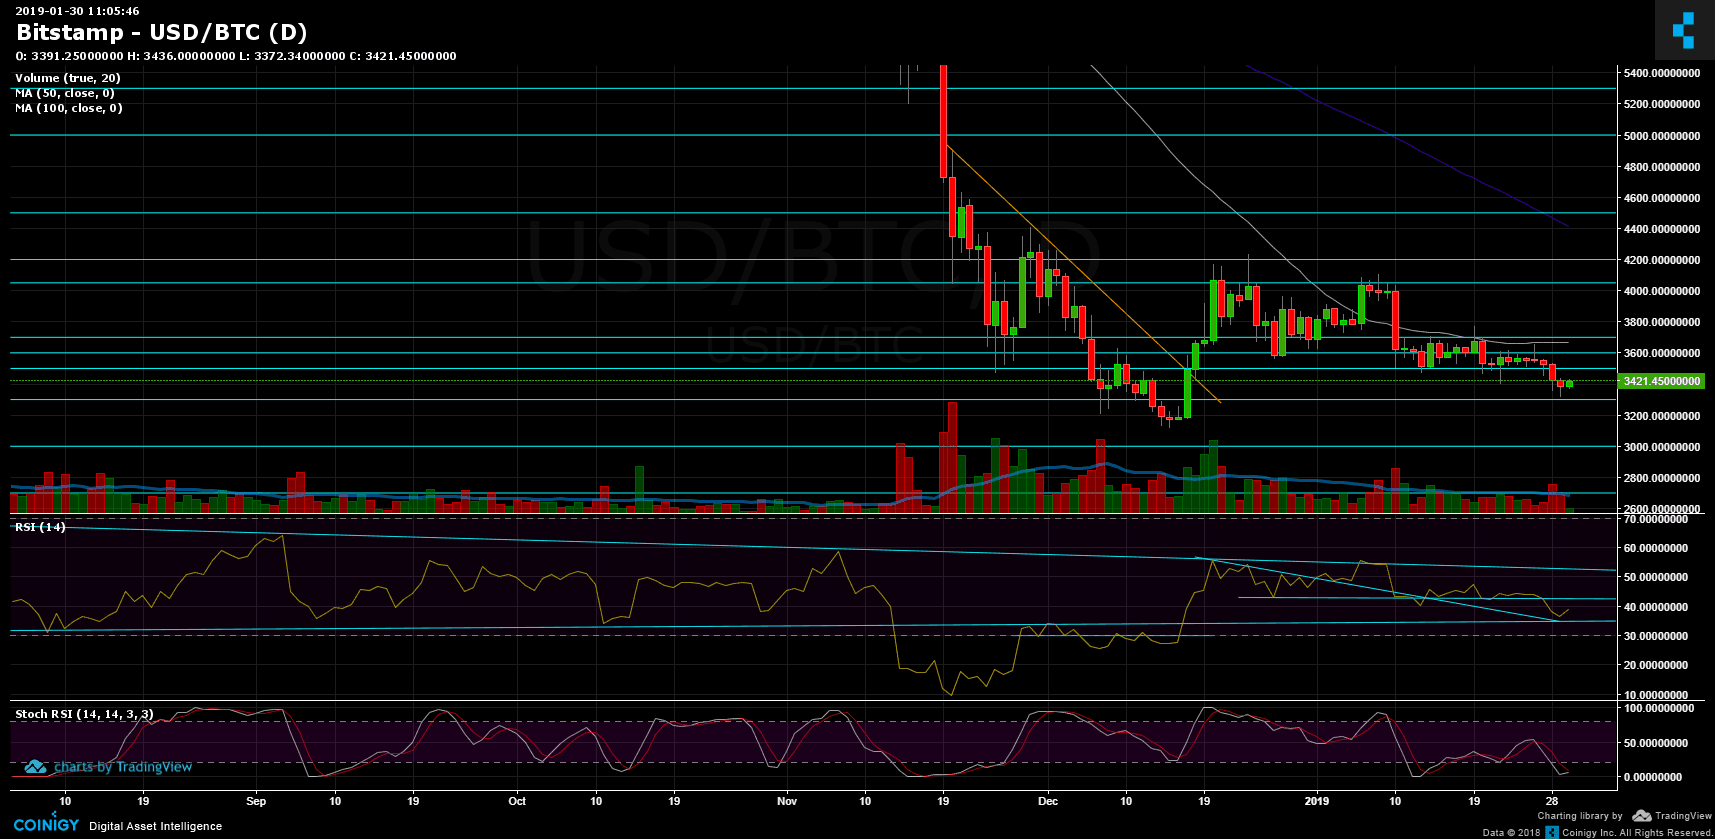
Yesterday, we pointed out that the daily RSI level was nearing support level. This led to correction with a current daily high at $3436 (Bitstamp).
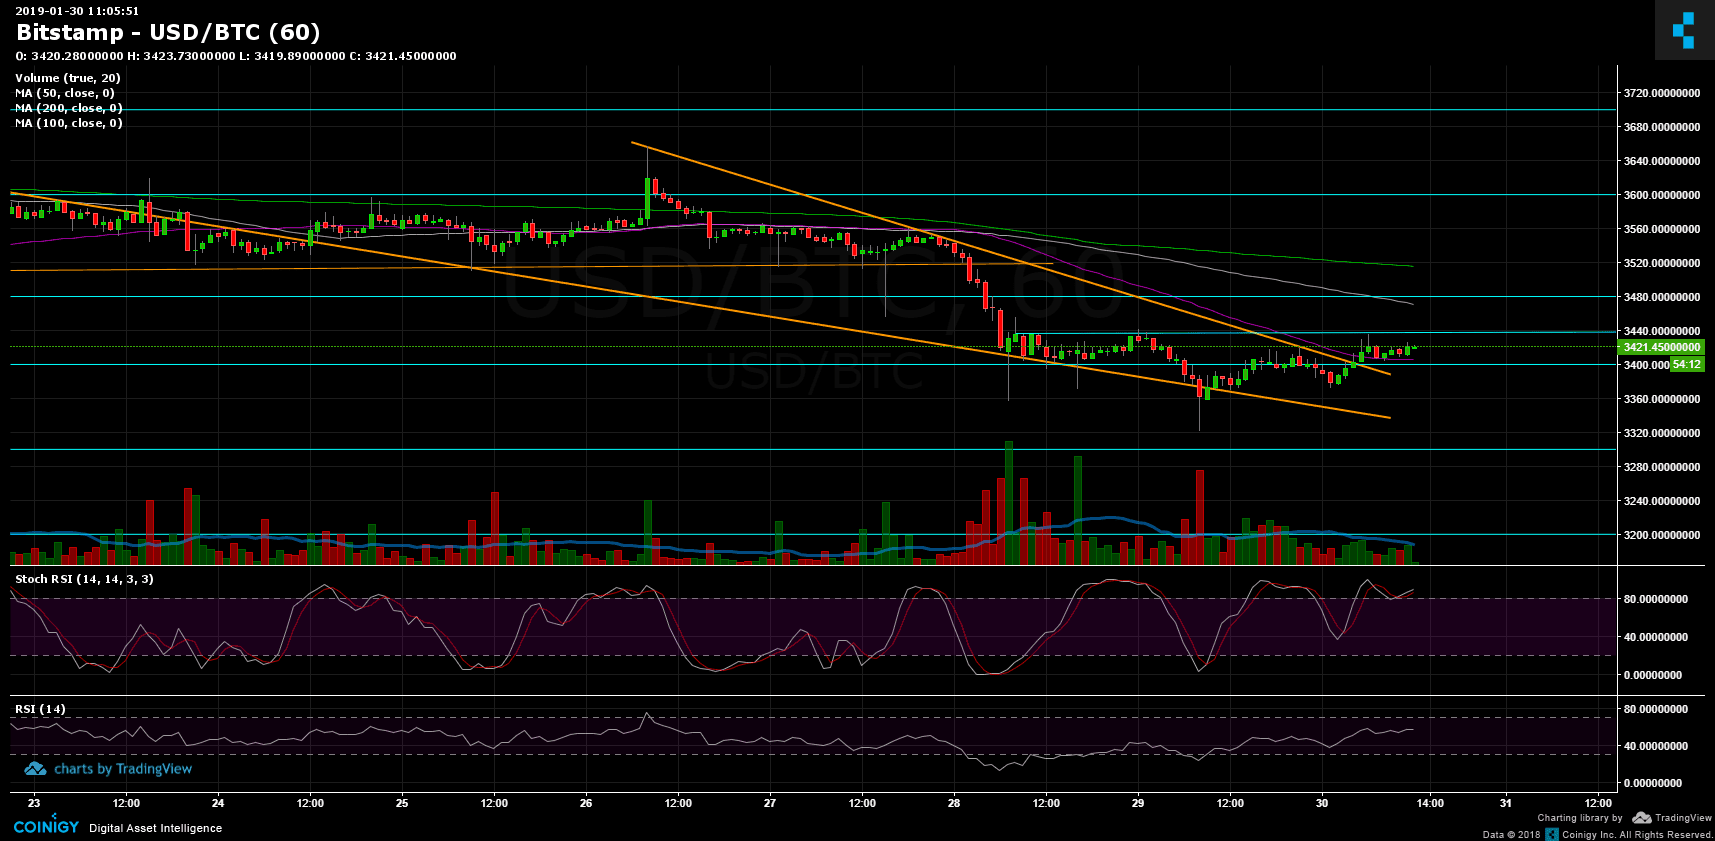
Over the past few hours, Bitcoin had been trading between the $3435 resistance and the $3400 support (along with the 4-hour chart’s 50 days moving average line, marked purple on the chart).
Looking at the 4-hour chart, Bitcoin was forming a falling wedge pattern and broke out of it to the bull side. Then, broke up the 50 days MA line.
The total market cap is $113 billion which is a slight increase from yesterday.
Looking at the 1-day & 4-hour charts
- From the bull side, the next resistance lies at $3435. Breaking up could send Bitcoin to the next resistance area of $3480 – $3500 (along with the 100 days moving average line, marked white). The last was a significant support zone before it got broken down. From that reason it turned into a tough resistance area. The next levels beyond are $3600 and $3700.
- From the bear side, support levels lie at $3400, $3300 – $3320 and $3200 before reaching the level of $3120, which is the 2018 low.
- Looking on the daily chart’s RSI: The RSI had found support around the level of 35 and turned around. As of now, there is some more space to move up before reaching the support turned resistance RSI trend-line at 43.
- Stochastic RSI of the daily chart is about to cross over at the oversold area. In case this plays out and crosses, following a high amount of volume, we could expect a deeper correction to the positive side.
- The trading volume of yesterday decreased from the day before and ended up around the average volume of the past two weeks.
- BitFinex’s open short positions increased to 26.8K BTC of open positions. Not a significant amount, far from the low/high numbers that could initiate squeeze moves.
BTC/USD BitStamp 4-Hour chart

BTC/USD BitStamp 1-Day chart

The post Bitcoin Price Analysis Jan.30: BTC Is Back Above $3400. Would That Hold? appeared first on CryptoPotato.


