Bitcoin Price Analysis Jan.29: BTC Breaks Down, Getting Closer To 2018 Lows
And there it came: after long anticipation, Bitcoin finally broke down from the $3500 – $3600 range. This is no surprise to whoever read the last couple of BTC updates here, we’ve mentioned more than once that the chances of a breakdown of the range are a lot higher than those of breaking up.
As can be seen, the daily trading volume of yesterday is the highest volume level of the past 20 days.
The crypto market cap has shrunk to $111 billion, as of writing this update. The psychological level of $100 billion is in sight (again). In the case of re-testing the prior lows of 2018, the total market cap is likely to be around that level.
The above number, $100 B, was tested once as support on December 15, 2018.
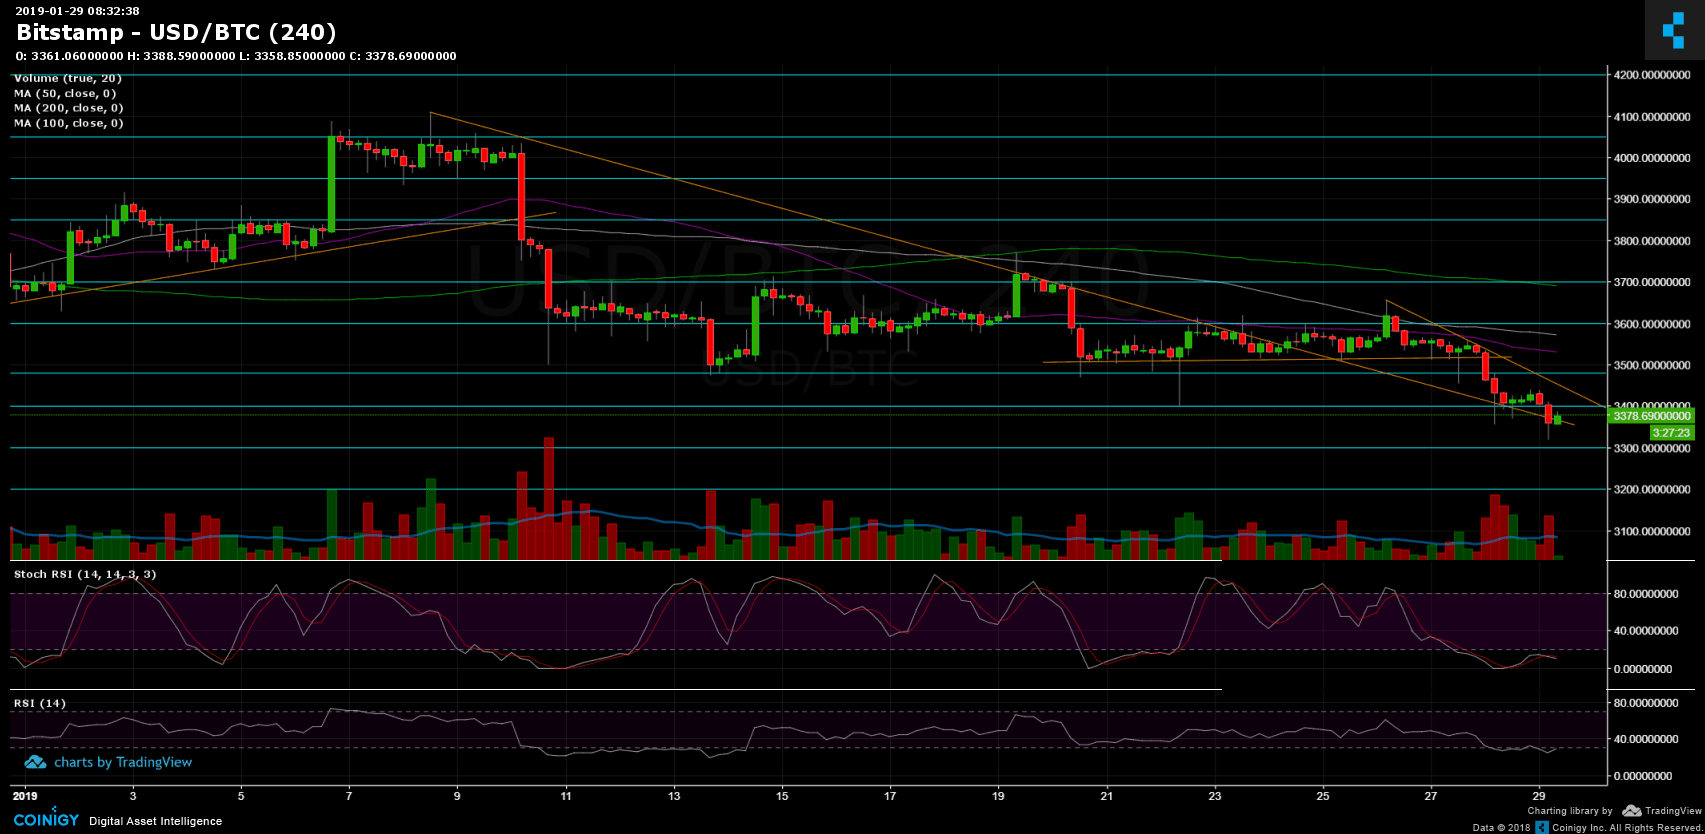
Looking at the 1-day & 4-hour charts
- Following the breakdown of the crucial $3480 – $3500 range and $3400, Bitcoin had just recently marked $3320 as the current daily low. This is very close to the next marked significant support level at $3300.
- If BTC breaks down from the $3300 support, it will likely be sent to retest $3200 and $3120, which is the lowest level of Bitcoin in 2018.
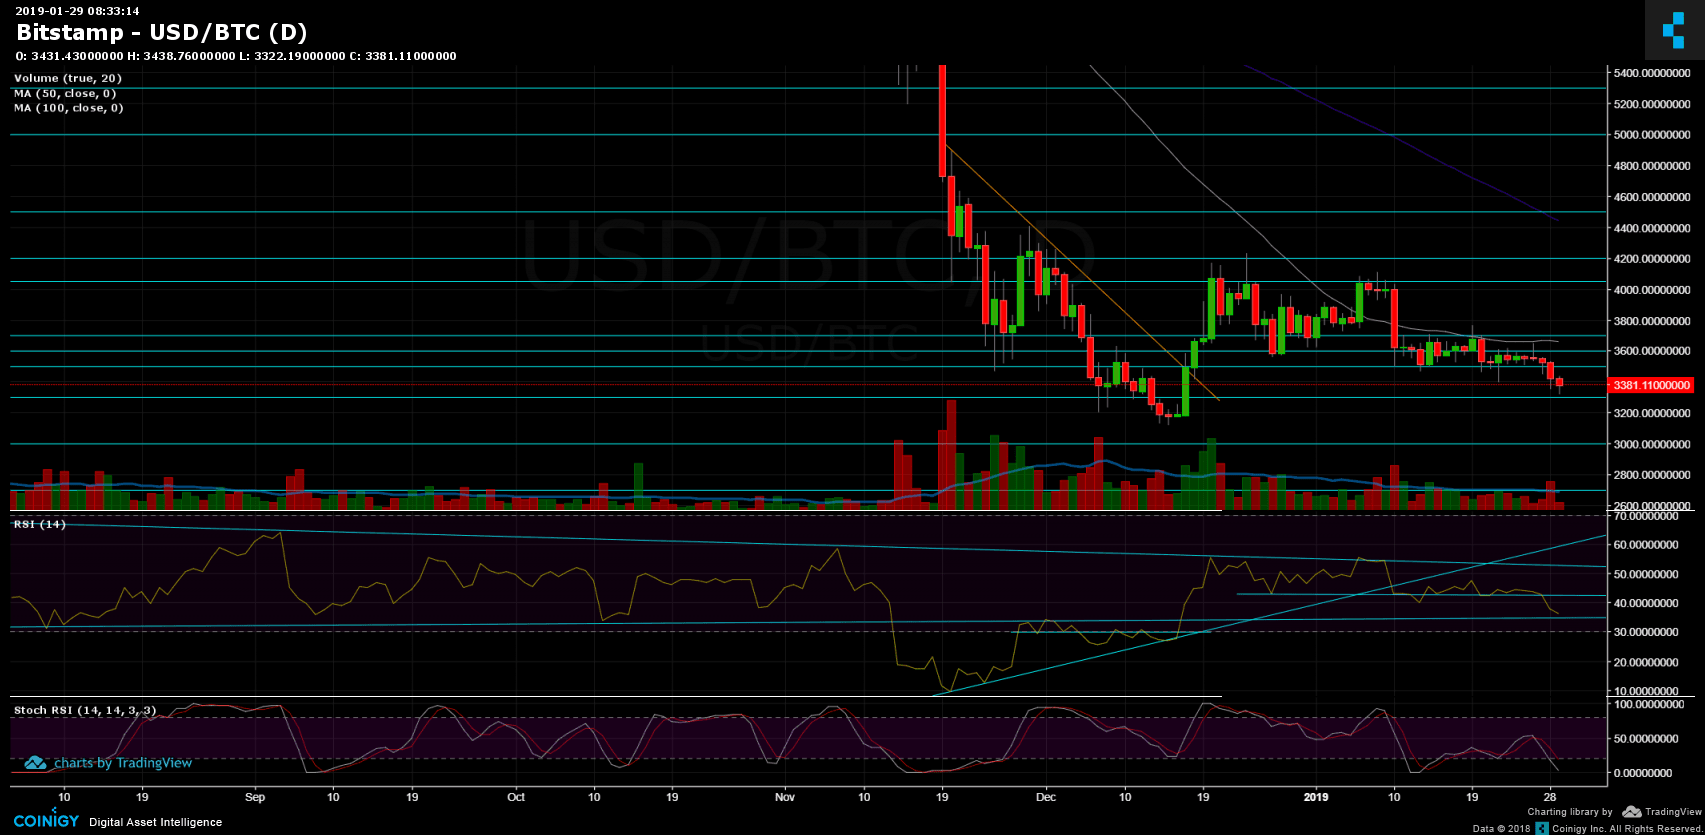
- However, the daily RSI is reaching the long-term support trend-line, along with the level of 30 (below RSI’s level 30 an asset is considered as oversold). Stochastic RSI oscillator is also very low on both the 4-hour and the 1-day chart. More than that, following the mid-term descending trend-line (marked with orange on the 4-hour chart), the current 4-hour candle is critical as it ‘fights’ to stay on top of the trend-line.
- The above could lead to a recession of the declines with a retest of prior support turned resistance areas. Those areas might be $3400, $3480 – $3500 or beyond (as of now, the chances seem low).
- As mentioned before, the trading volume of yesterday was the highest of the past 20 days. However, this is far from the volume levels we’ve seen during November 2018.
- BitFinex’s open short positions increased to 26K BTC of open positions. Not a significant amount, far from the low/high numbers that could initiate squeeze moves.
BTC/USD BitStamp 1-Hour chart
BTC/USD BitStamp 1-Day chart
The post Bitcoin Price Analysis Jan.29: BTC Breaks Down, Getting Closer To 2018 Lows appeared first on CryptoPotato.