Bitcoin Price Analysis Jan.16: Stability Around $3600, But The BTC Shorts Chart is Worrying
Following our previous price analysis, the significant Stochastic RSI oscillator had crossed over at the oversold area.
This led to the anticipated positive correction, which produced a nice move to re-test $3700 tough resistance area. The mentioned resistance includes the 4-hour chart’s 200 days moving average line and the daily chart’s 50-day moving average line.
From there, Bitcoin got rejected, and along with the bad news which came from Ethereum, broke down the $3600 one more time, to find support on the ascending trend-line.
Looking at the 1-day & 4-hour charts
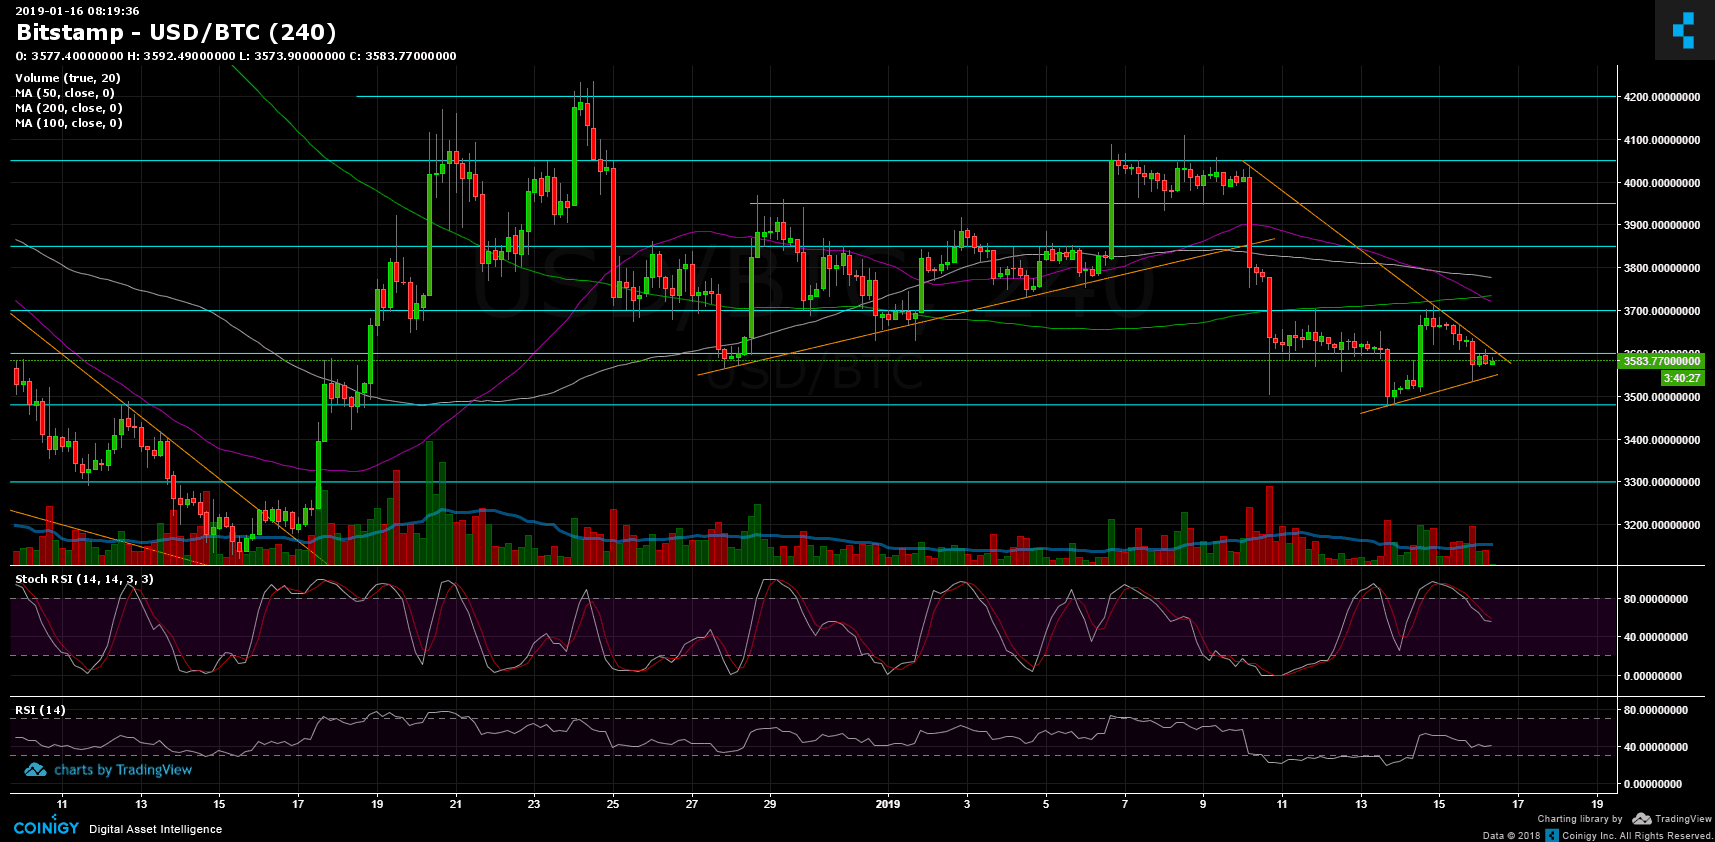
- Bitcoin is now trading between a descending and an ascending trend-line (marked in orange on the following 4-hour chart), which forms up a triangle. The apex of the triangle is nearby. Hence, we do expect a move to either direction during the next couple of hours.
- From above, the next resistance levels are $3600, $3700 (as described above) and $3800 (along with the 50 days moving average line of the 4-hour chart).
- From below, $3480 – $3500 is the weekly low. The next support levels lie at $3400 and beyond – $3300.
- The Daily Chart: The RSI indicator found support on top of the 43 RSI line. This could be a positive sign unless it will break down shortly.
- The trading volume is still pretty low. However, the average volume is still twice the volume traded before the breakdown of the $6000 level.
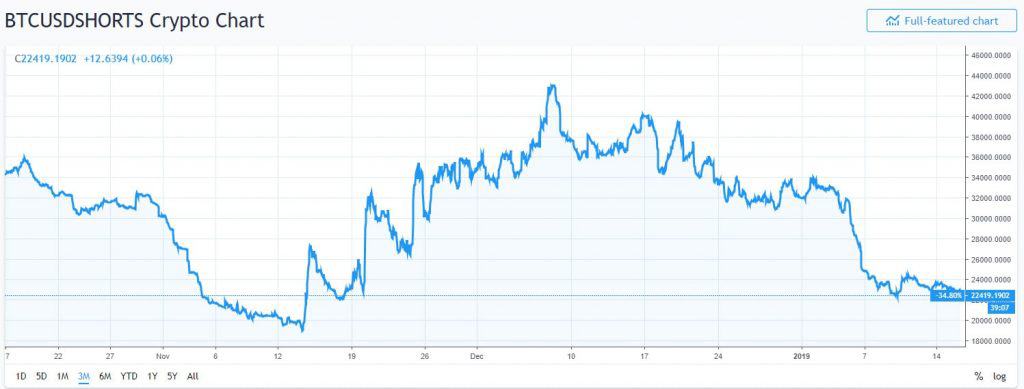
- BitFinex’s open short positions dropped again to 22.4K, which is the lowest level since November 14 (the day when Bitcoin broke down the $6000 support line). A long squeeze coming up? Remember – when shorts are at their high – expect a short squeeze, and vice versa. This is why the bulls don’t like the current situation here.
BTC/USD BitStamp 4-Hour chart
BTC/USD BitStamp 1-Day chart

The post Bitcoin Price Analysis Jan.16: Stability Around $3600, But The BTC Shorts Chart is Worrying appeared first on CryptoPotato.