Bitcoin Price Analysis Jan.14: The Move is Here Following BTC Breakdown
As we stated yesterday, Bitcoin was waiting for the next major move, which came just hours after our analysis was published. We also noted that the chances of a breakdown are much higher than the ones of a breakup.
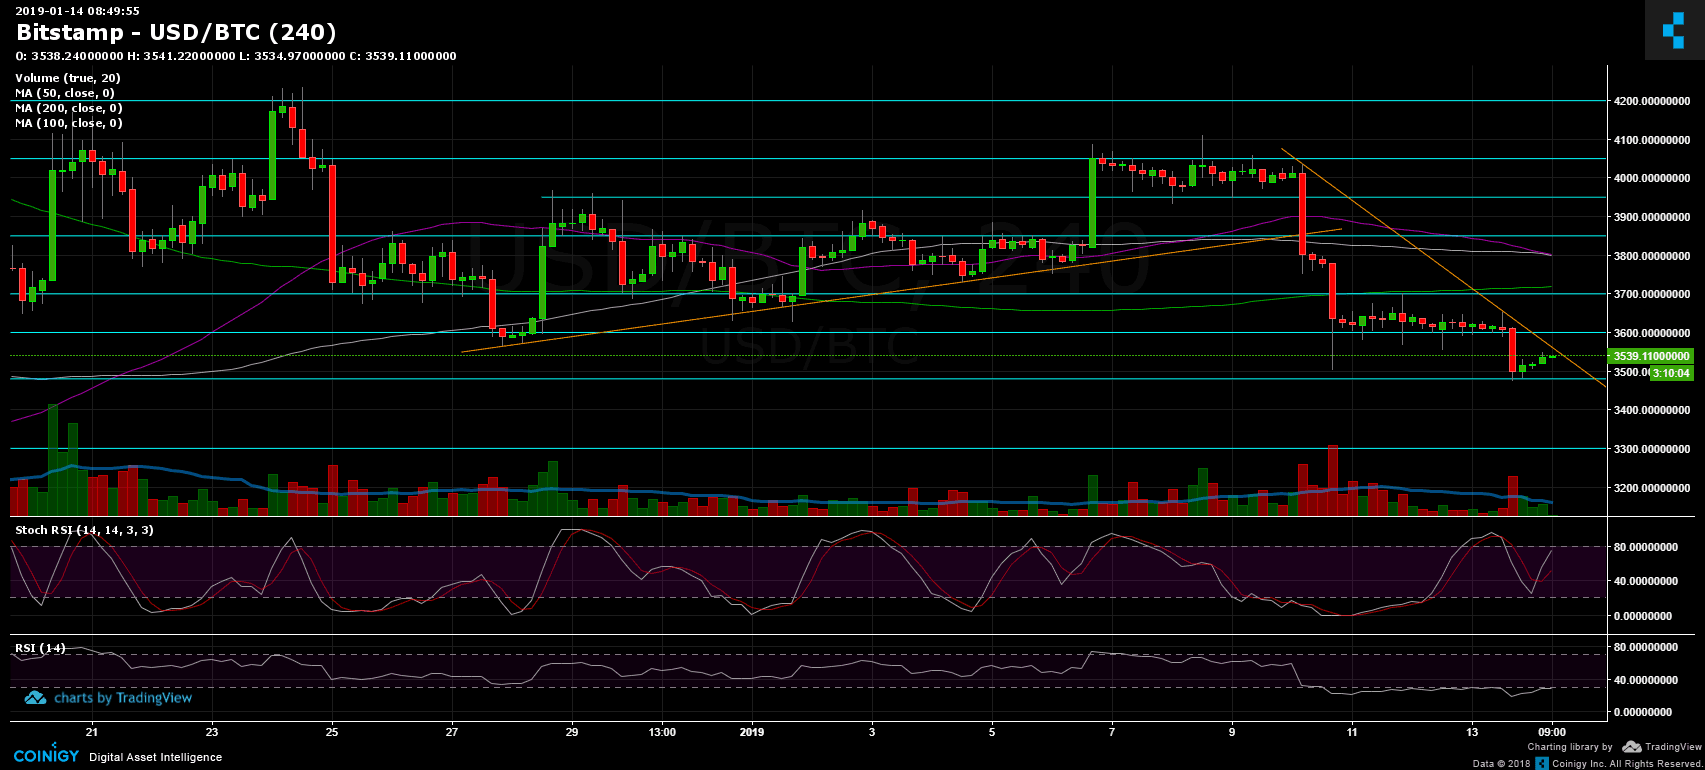
The $3600 support level was broken sharply, in less than an hour, as BTC marking exactly $3480 as the daily low. The last is the support level we mentioned yesterday.
From there, we’ve seen a slow positive correction: Yes – Bulls Walk Up the Stairs-Bears Jump Out the Window.
Fun fact: Exactly 4 years ago, the bear market of 2014 had ended with this capitulation candle with a low of $152.
Looking at the 1-day & 4-hour charts
- Following the breakdown of the $3600 level, the next support area is $3480 – $3500 (which is also the daily low). This is a crucial support zone. Breaking it down could send Bitcoin to re-test prior support at $3300, $3200 and the 2018 low of $3120.
- From the bull side, Bitcoin is expected to encounter a descending trend-line during the next hours (~$3550). The further target is the $3600 support turned resistance level, along with $3700 resistance (4-hour chart’s 200 days moving average line and 1-day’s 50 days moving average line).
- Some relief signs: We should watch the daily chart’s Stochastic RSI oscillator which is about to cross over at the oversold area. This could lead to a positive correction for the upcoming days. However, it hadn’t crossed yet.
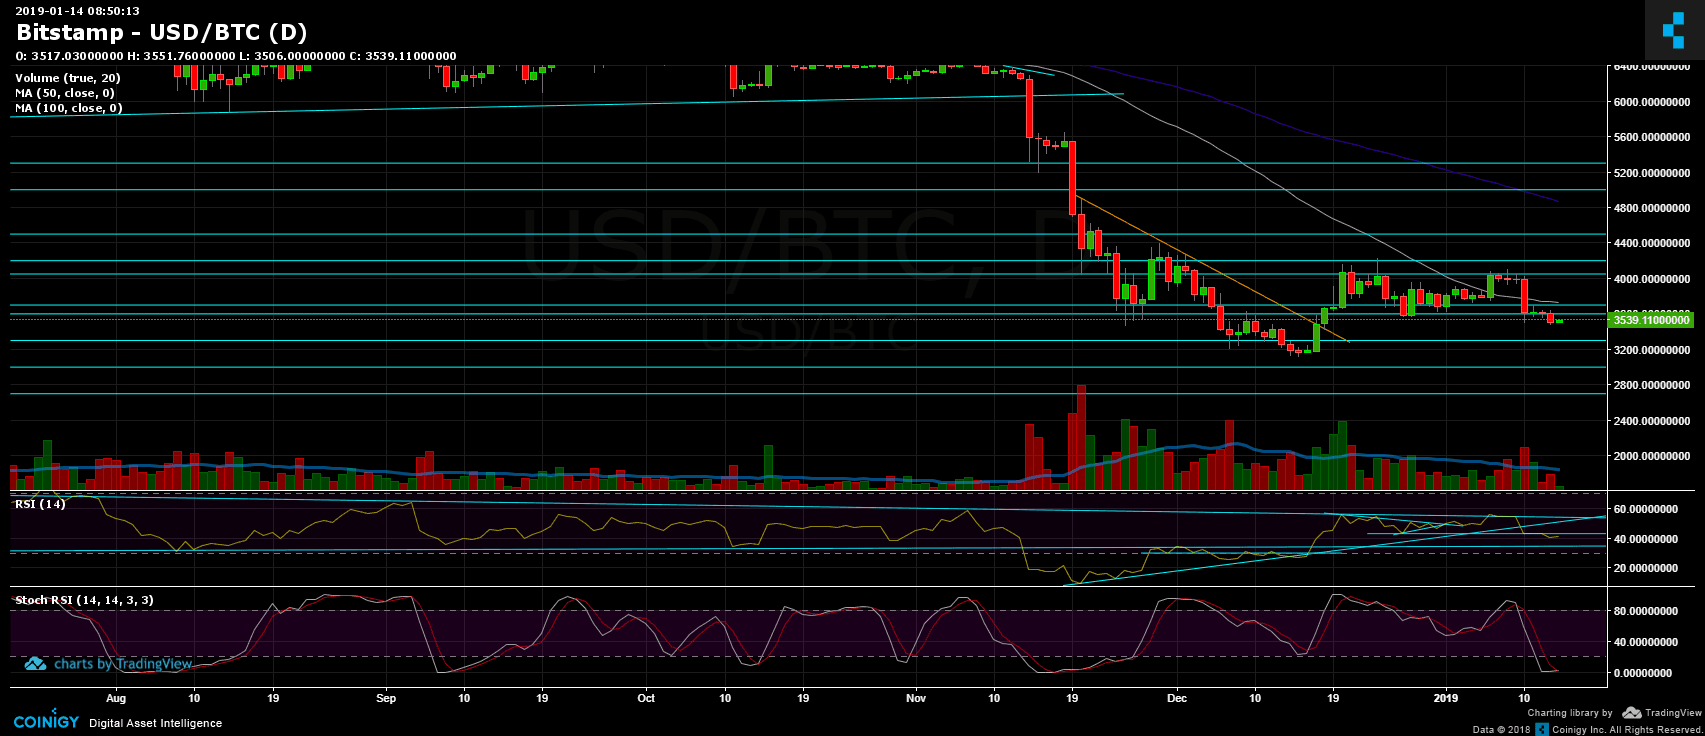
- The Daily Chart: The RSI indicator broke down the support level at 43. It seems like this area will be tested again, from below, as resistance.
- Trading volume: this field proves how easy it is to move this market. The past two days had a low amount of volume. This might also be due to the weekend.
- BitFinex’s open short positions had a slight gain to 23.5K.
BTC/USD BitStamp 4-Hour chart
BTC/USD BitStamp 1-Day chart
The post Bitcoin Price Analysis Jan.14: The Move is Here Following BTC Breakdown appeared first on CryptoPotato.