Bitcoin Price Analysis Jan.13: Waiting For The Next Significant Move
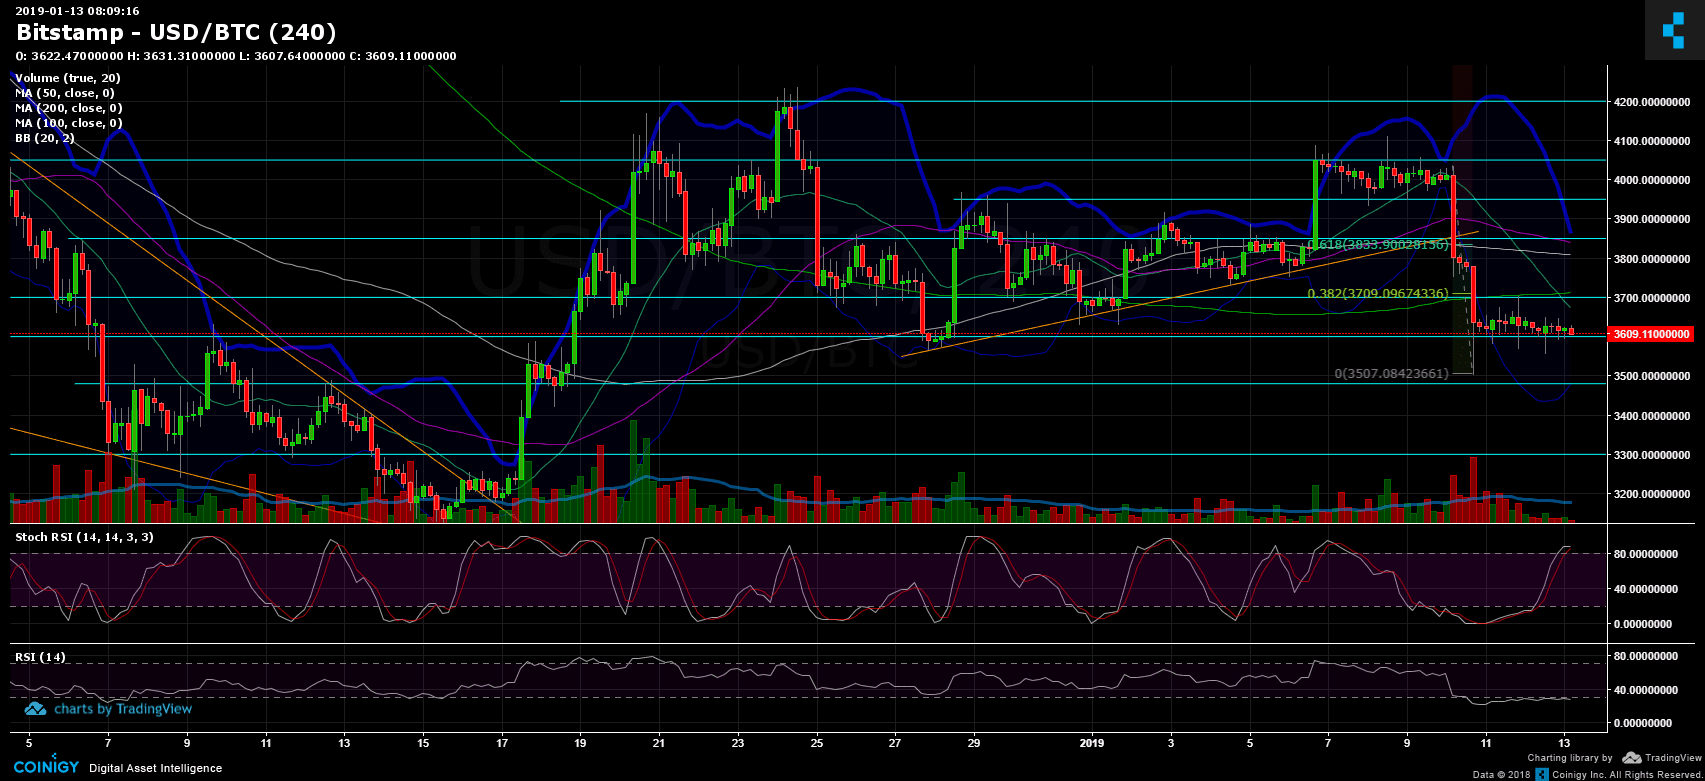
Over the past 48 hours since our previous BTC price analysis, there was not much of a change, as Bitcoin is hovering around the $3600 support level.
We mentioned the needed correction to the recent severe decline:
“We can say, with caution, that a correction could take place. Possible targets could be the significant support turned resistance $3700 (along with 200 days moving average line and Fibb retracement level 38.2% of the last decline)”
The correction was very modest, up to the significant support turned resistance of $3700 as described above. From there, Bitcoin headed back towards the $3600 area.
Looking at the 1-day & 4-hour charts
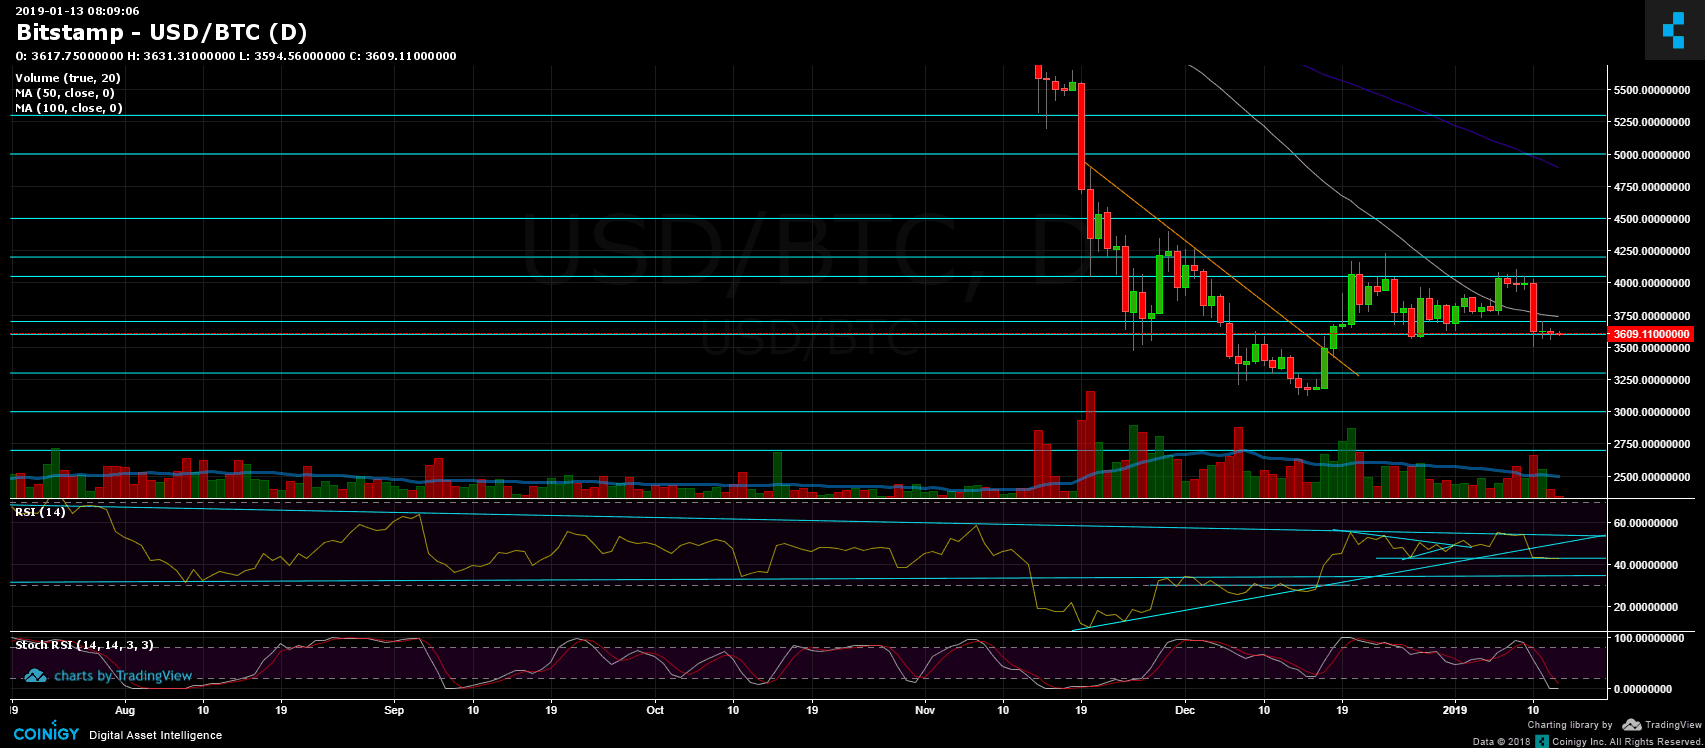
- The short-term picture from the recent analysis didn’t change much: The next support levels are at $3600 (current area), and $3480 – $3500. The last is a crucial support zone. Breaking it down could lead Bitcoin to discover new lows hadn’t seen yet in 2018. Breaking down the $3500 could send Bitcoin to re-test prior support at $3300.
- As trading goes, it seems that the chances of a breakdown of $3600 are much higher than those of breaking up. Add to it the 4-hour Stochastic RSI oscillator which is about to cross over around the overbought area.
- If, however, BTC manages to move up then the next targets could be $3700 (the level mentioned above), $3750 (the 1-day chart’s 50 days moving average line, marked in white), $3800 (resistance along with the 100 days moving average line) and $3850 (50 days MA).
- The Daily Chart: The RSI indicator is still getting support by the 43 critical line.
- Trading volume: Yesterday’s daily volume saw the lowest amount since Nov.18, 2018, (at least on Bitstamp, but it’s likely to correlate between exchanges). This could be likely because of the weekend and the low volatility.
- BitFinex’s open short positions dropped a bit to 23.2K.
BTC/USD BitStamp 4-Hour chart
BTC/USD BitStamp 1-Day chart
The post Bitcoin Price Analysis Jan.13: Waiting For The Next Significant Move appeared first on CryptoPotato.


