Bitcoin Price Analysis: Is BTC Ready to Explode to a New ATH Following the Recent Correction?
Bitcoin’s price has recently experienced a pullback below the $70K level, leaving market participants wondering whether the top is in or not. Yet, there are still several support levels available to hold the market from further decline.
Technical Analysis
By TradingRage
The Daily Chart
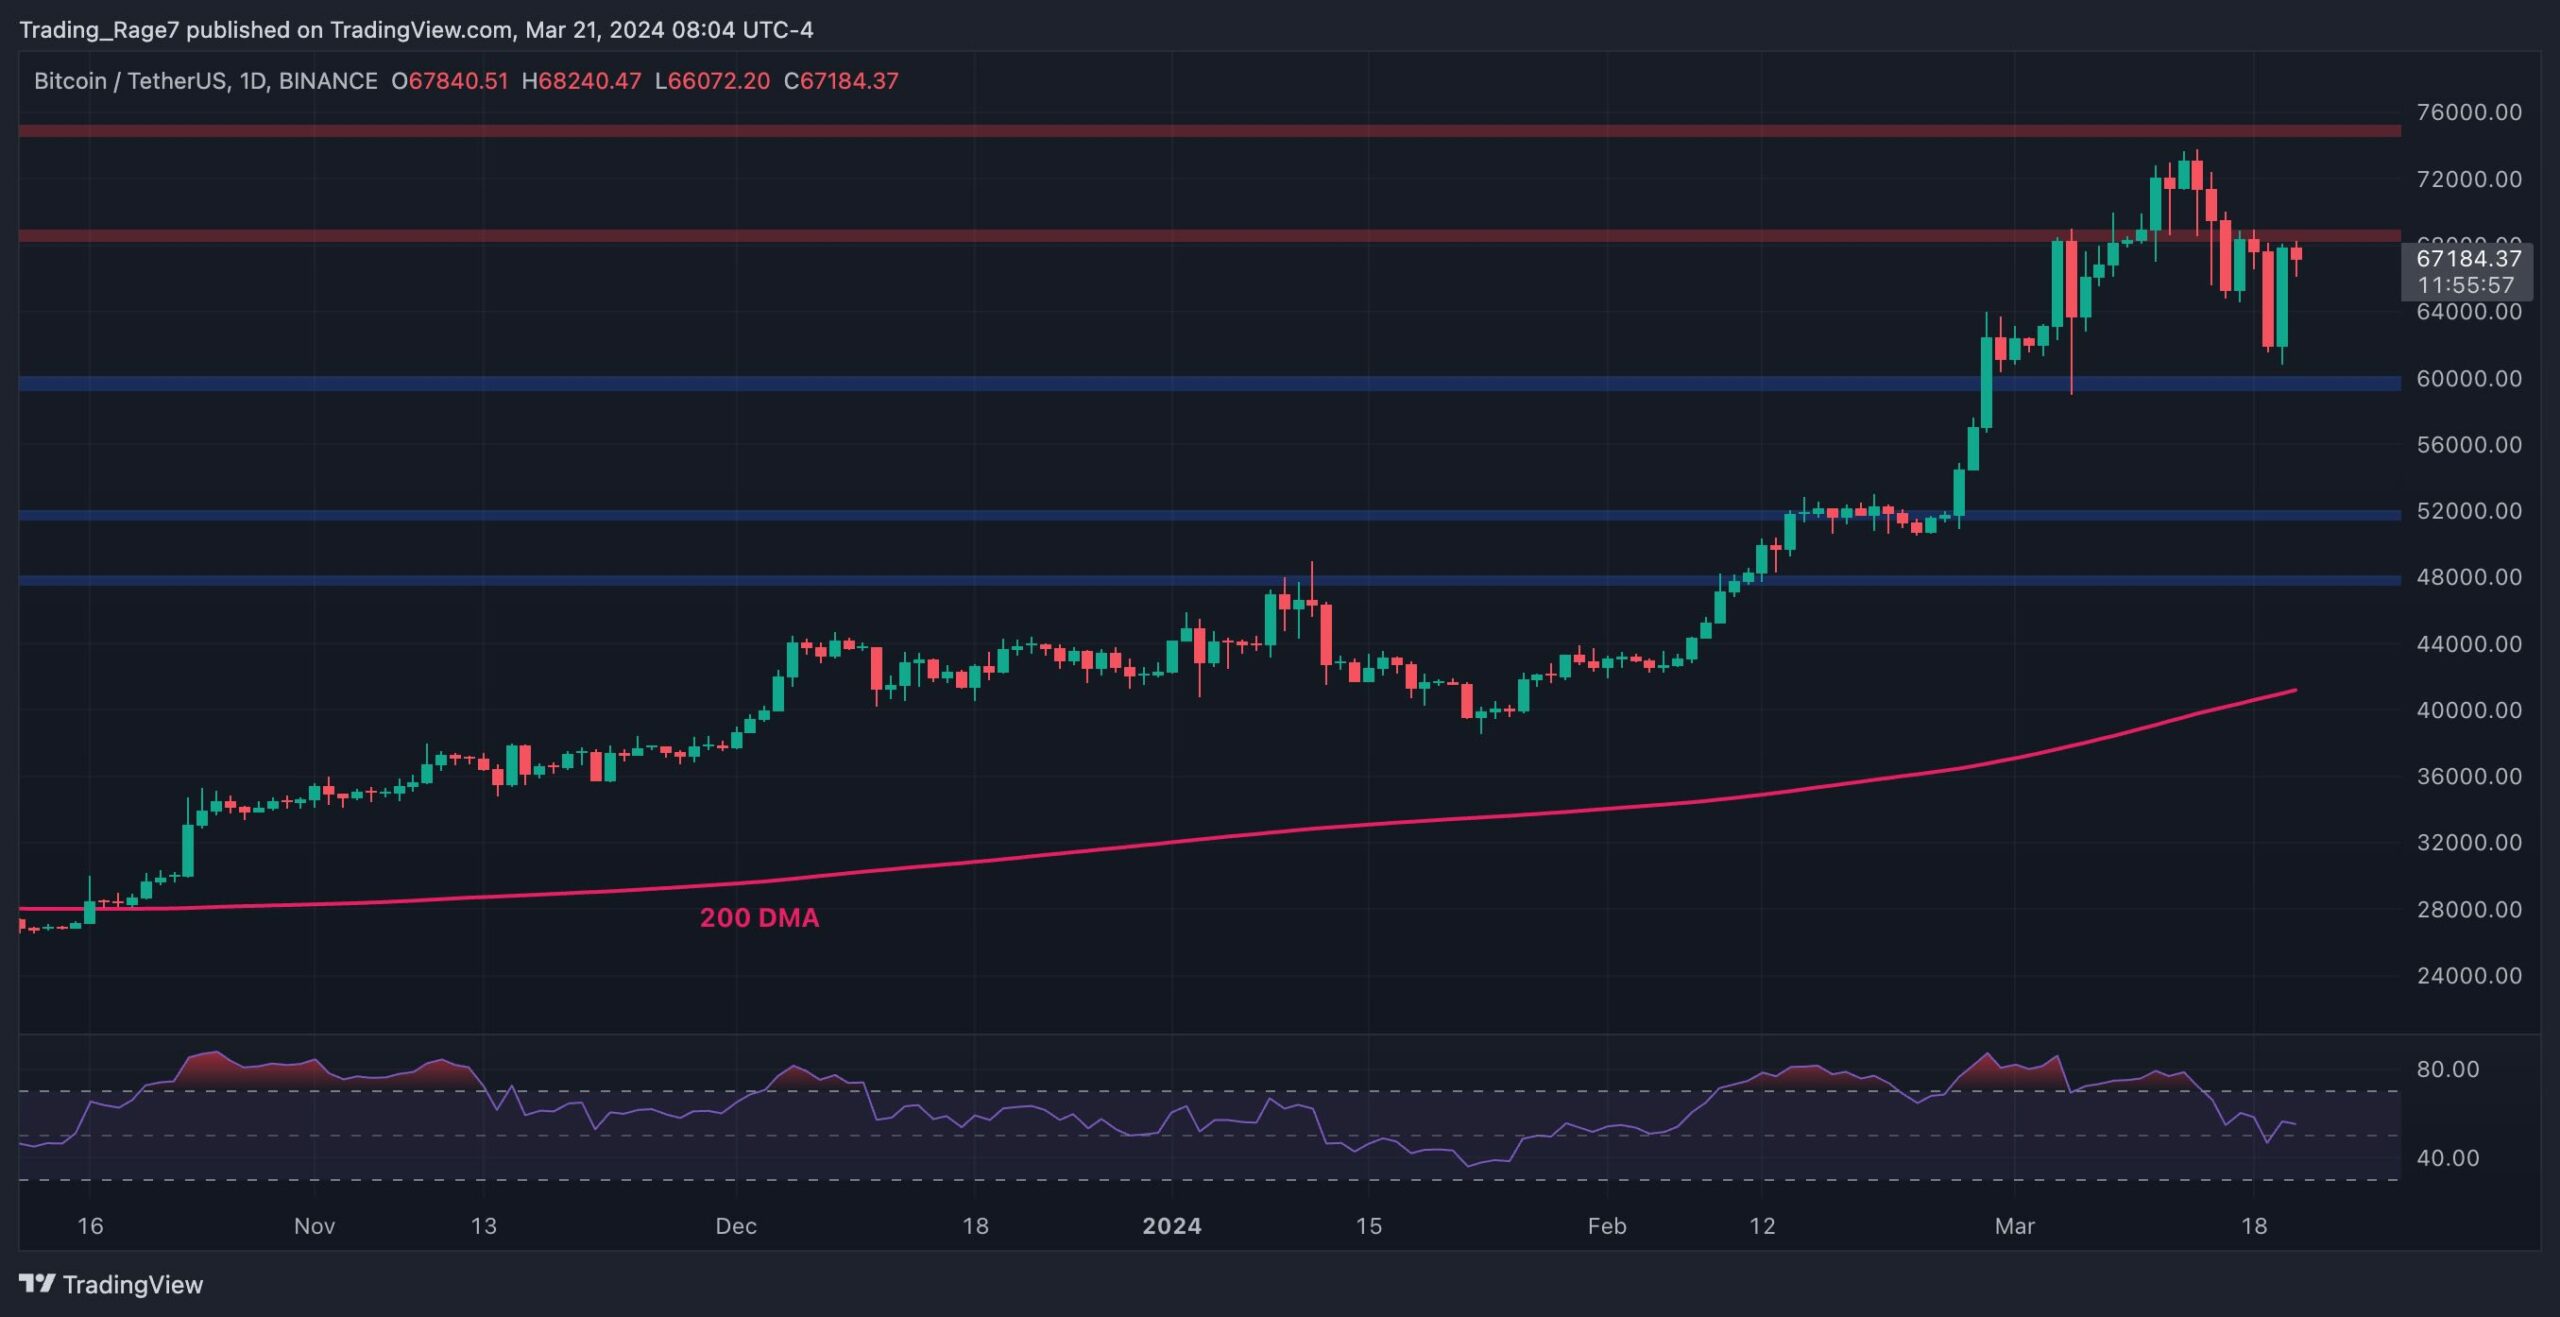
On the daily chart, the price has been rallying consistently since rebounding from the $40K level. However, the market has recently retreated from the $75K resistance level.
The $67K – $69K level is currently being tested, and if the market breaks back above, a bullish continuation would be probable. However, a rejection can lead to a drop toward the $60K and possibly lower.

The 4-Hour Chart
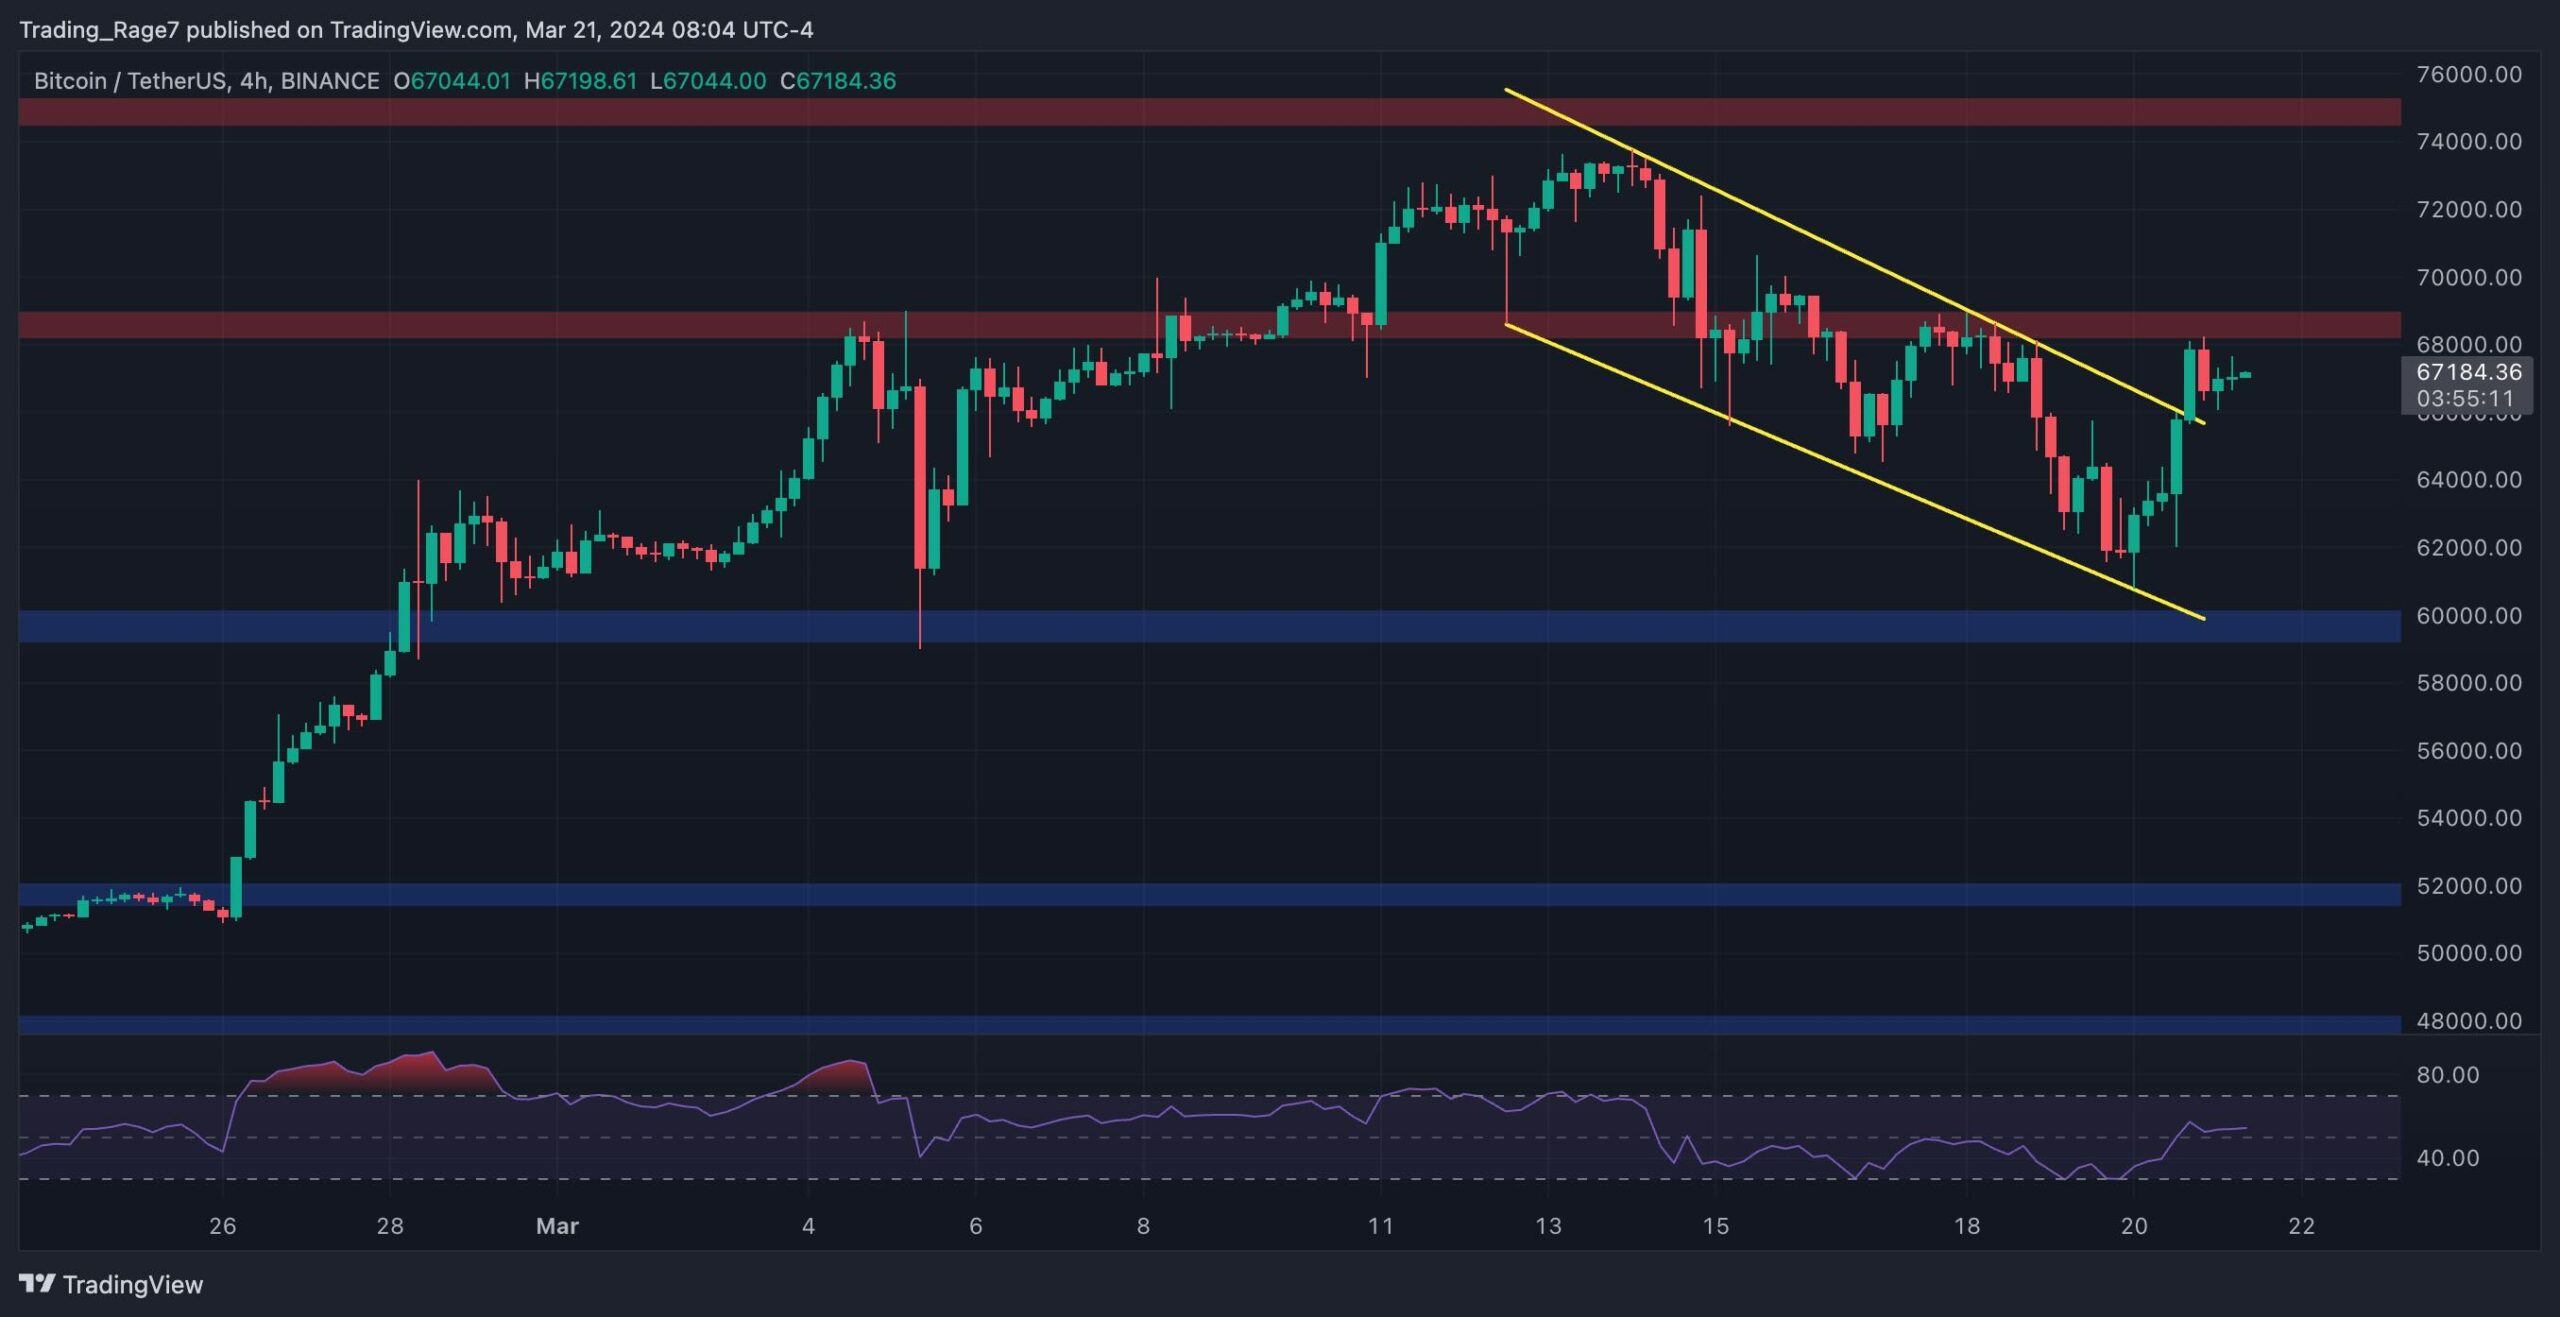
Looking at the 4-hour timeframe, the price has been declining inside a descending channel. Yet, the market has finally broken the higher boundary of the channel and is currently testing the $67K – $69K zone.
If the level breaks, a rise toward the previous high of around $74K and beyond would be imminent. Meanwhile, if the price drops back inside the channel, things might go ugly as it would indicate a fake breakout and result in a drop back to the $60K level in the short term.

Sentiment Analysis
By TradingRage
Bitcoin Funding Rates
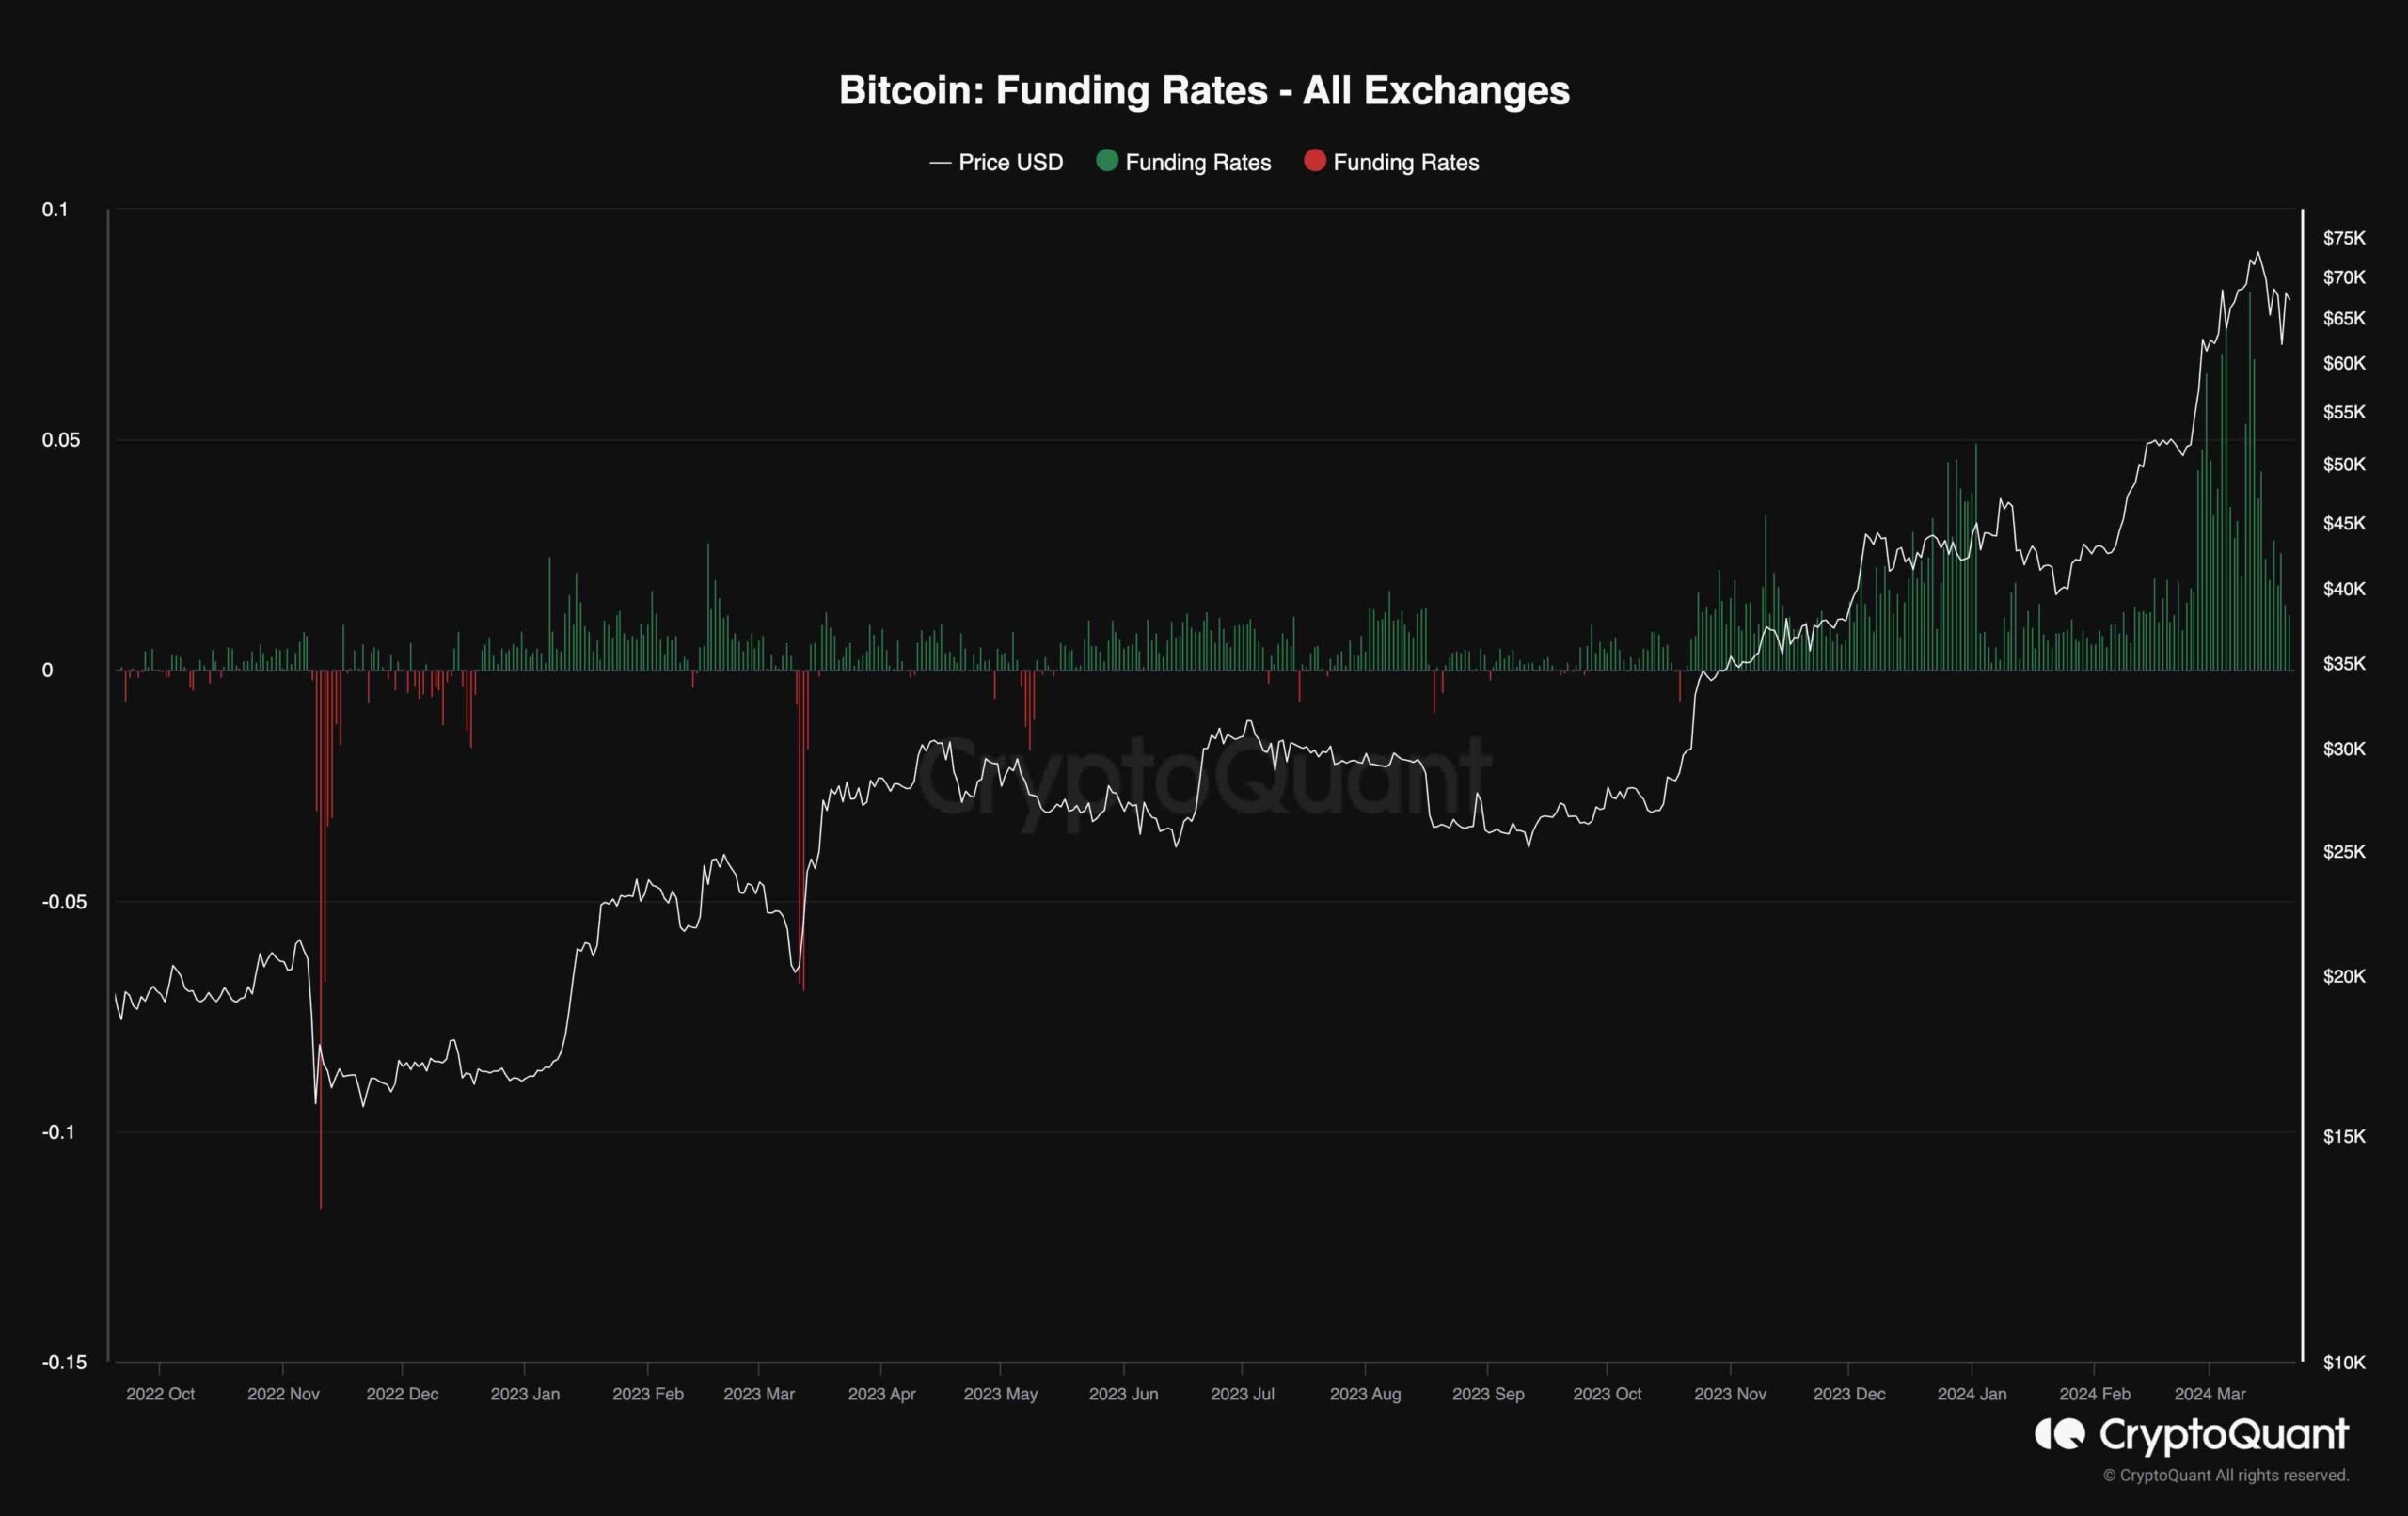
Bitcoin’s price has recently experienced a pullback, dropping below the $70K mark. Analyzing whether this correction has caused the futures market to cool down would be beneficial for investors.
This chart demonstrates the Bitcoin funding rates, which measure whether the buyers or sellers are executing their orders more aggressively. High funding rates usually lead to a long liquidation cascade. Therefore, while positive funding rates are necessary, high values can be concerning.
As the chart demonstrates, the price has been experiencing a drop recently. This has led to a decline in funding rates, which indicates that the futures market has cooled down. This can be a good sign, as it reduces further liquidations and can lead to a sustainable uptrend.

The post Bitcoin Price Analysis: Is BTC Ready to Explode to a New ATH Following the Recent Correction? appeared first on CryptoPotato.


