Bitcoin Price Analysis: Is a Short-Term Correction Incoming as BTC Forms Bearish Divergence?
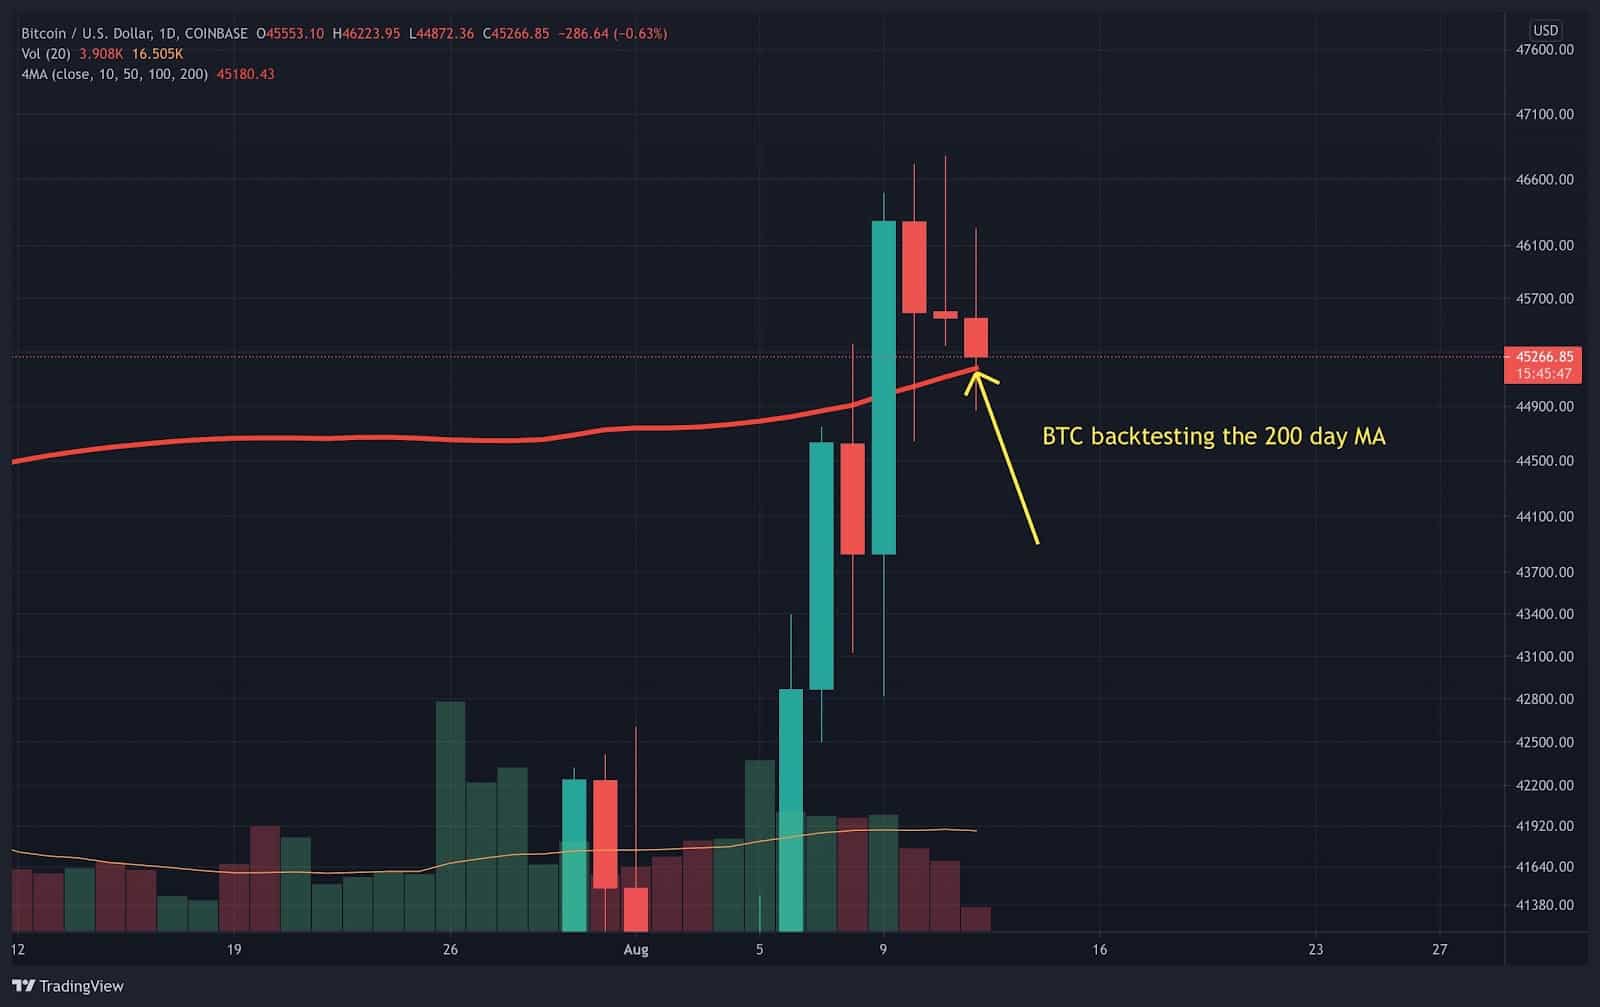
BTC’s multiple daily closes above the 200-day MA have been bullish, but for the past 3 days, the 4-hour chart has been showing bearish divergence.

This puts BTC in a tight spot in terms of technicals and timing. Last week, BTC managed to make an intraweek high above the 21-week moving average and 200-day moving average but found selling pressure heading into the weekly close.
BTC had a shorter-than-expected pullback to $42.8k and staged another attempt to push above the 21-week moving average and the 200-day moving average this week.
BTC must make a strong weekly close above these levels to confirm the first major step in re-entering bull market continuation.
Risk of a Short-Term Correction Increasing for Bitcoin’s Price
Given the bearish divergence on the 4-hour chart, the risk of a near-term consolidation or pullback has been increasing. This started appearing earlier in the week as BTC pushed higher, while the relative strength index made lower highs. BTC is currently backtesting the 200-day moving average for the second time this week.
Ideally, for the bulls, BTC needs to consolidate in a tight range around the 200-day moving average to avoid the risk of falling back below this critical level. Doing so will help cool off the technicals and prepare for the next push higher. BTC bulls would like to see the consolidation finish near the tail end of the week with a strong rally to mark the first weekly close above the 21-week and the 200-day moving average.
A weekly close above these major levels will flash a very bullish buy signal of a technical breakout, likely encouraging a new wave of capital to enter BTC, driving price higher.
Outlook Bullish in the Long-Term
Overall, from a technical view, BTC’s mid to long-term trend has been significantly improving with momentum continuing to strengthen. BTC bulls are now waiting for a major buy signal to flash on the weekly chart.
On-chain data is looking very bullish at the moment, indicating this pullback is likely technical-driven selling, rather than long-term holders planning exit liquidity as previous bear markets have shown.
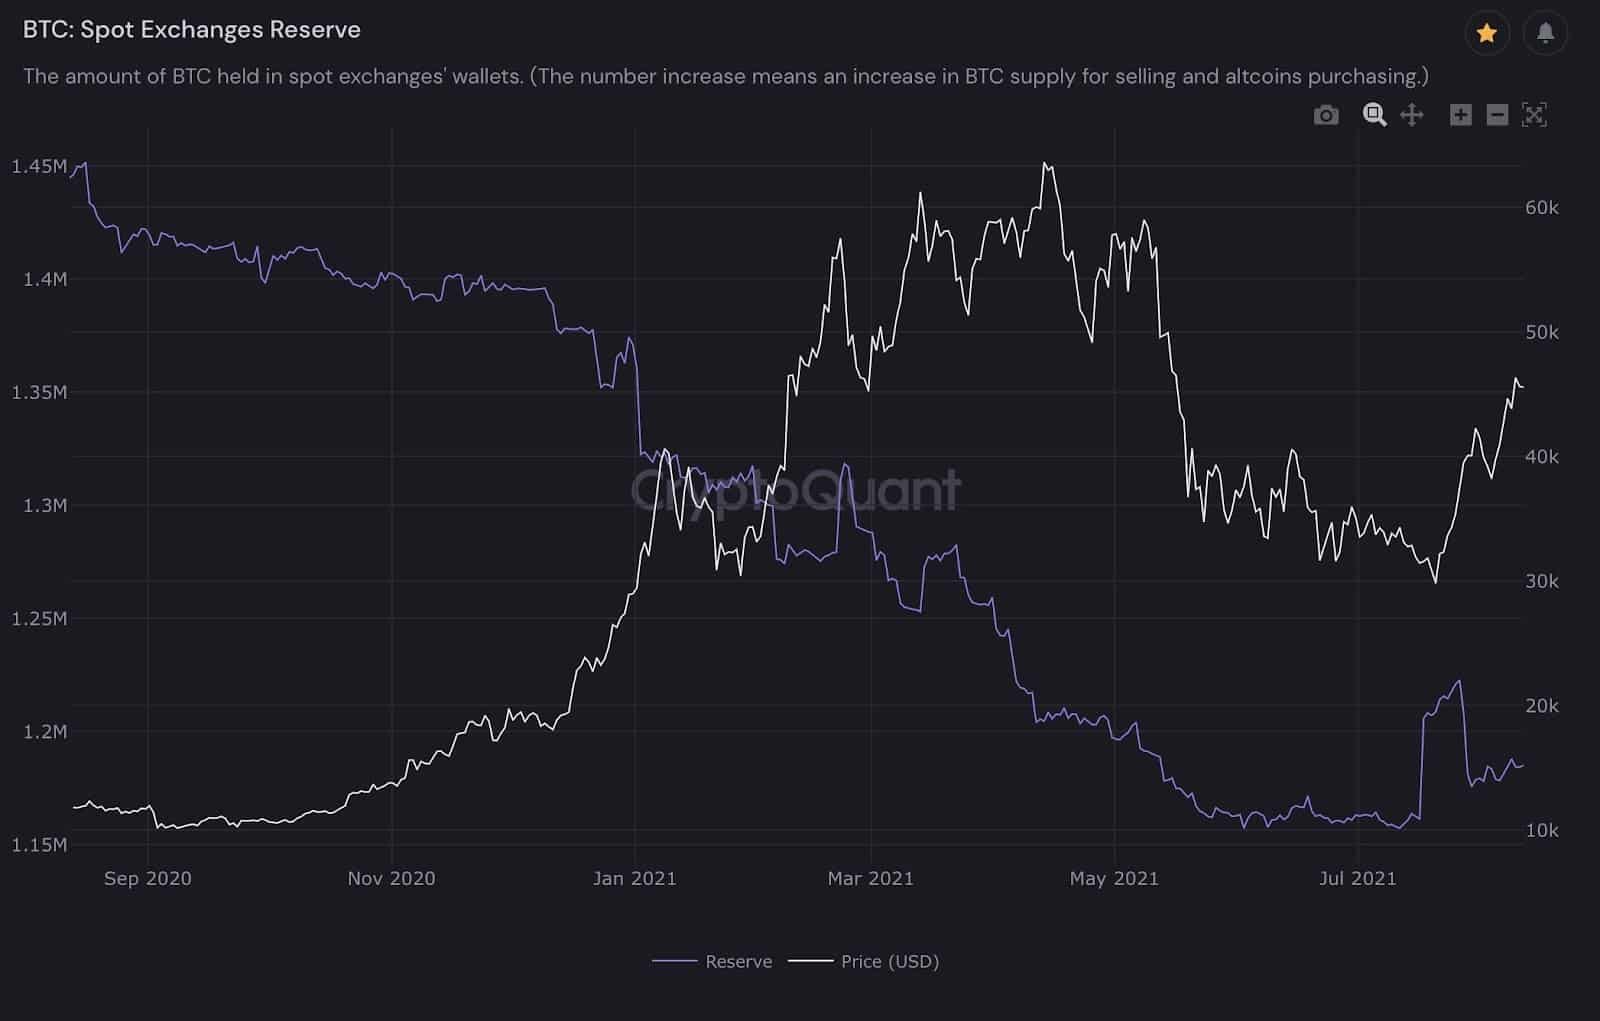
The recent 3-day consolidation and pullback have declining volume, which signals weak selling pressure. CryptoQuant data clearly shows there have been more total net outflows on spot exchanges during this period. On-chain data on spot exchange reserves and spot exchange net flows shows the recent rally has been driven by spot buying – something essential in a recovery phase of the market. Notably, spot exchange reserves have fallen to multi-year lows, a strong signal that BTC is being accumulated and being withdrawn from exchanges by large buyers.

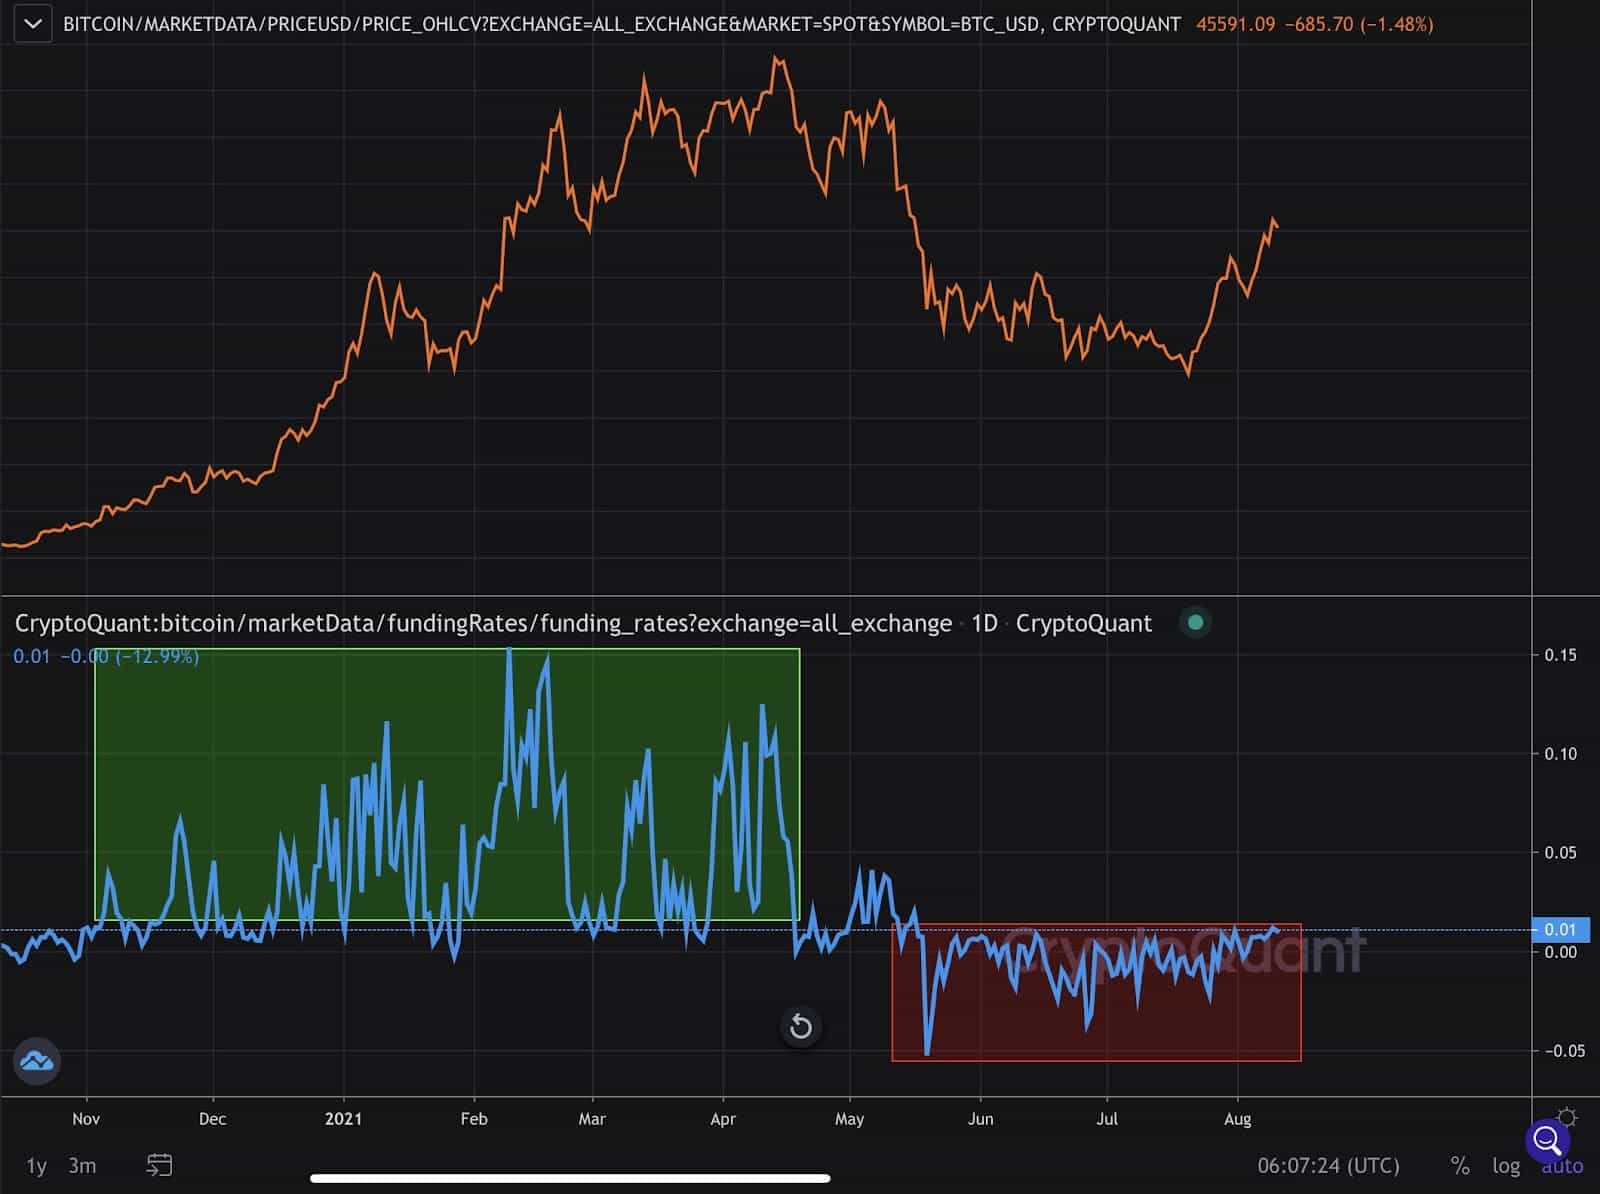
Neutral to negative funding rates on derivative platforms and rising futures open interest implies the bears are skeptical of this rally and continue to pile on shorts. When funding rates remain neutral to negative for extended periods of time with rising open interest, it indicates the market is net short, which increases the probability of a short squeeze that can send prices significantly higher.

BTC has rallied more than 62% from the lows, and BTC funding rates remain neutral to negative. This strongly suggests there is room for further upside given the market remains net short. Spot buying will be one of many catalysts to squeeze the shorts and help BTC confirm the breakout into bull market continuation.
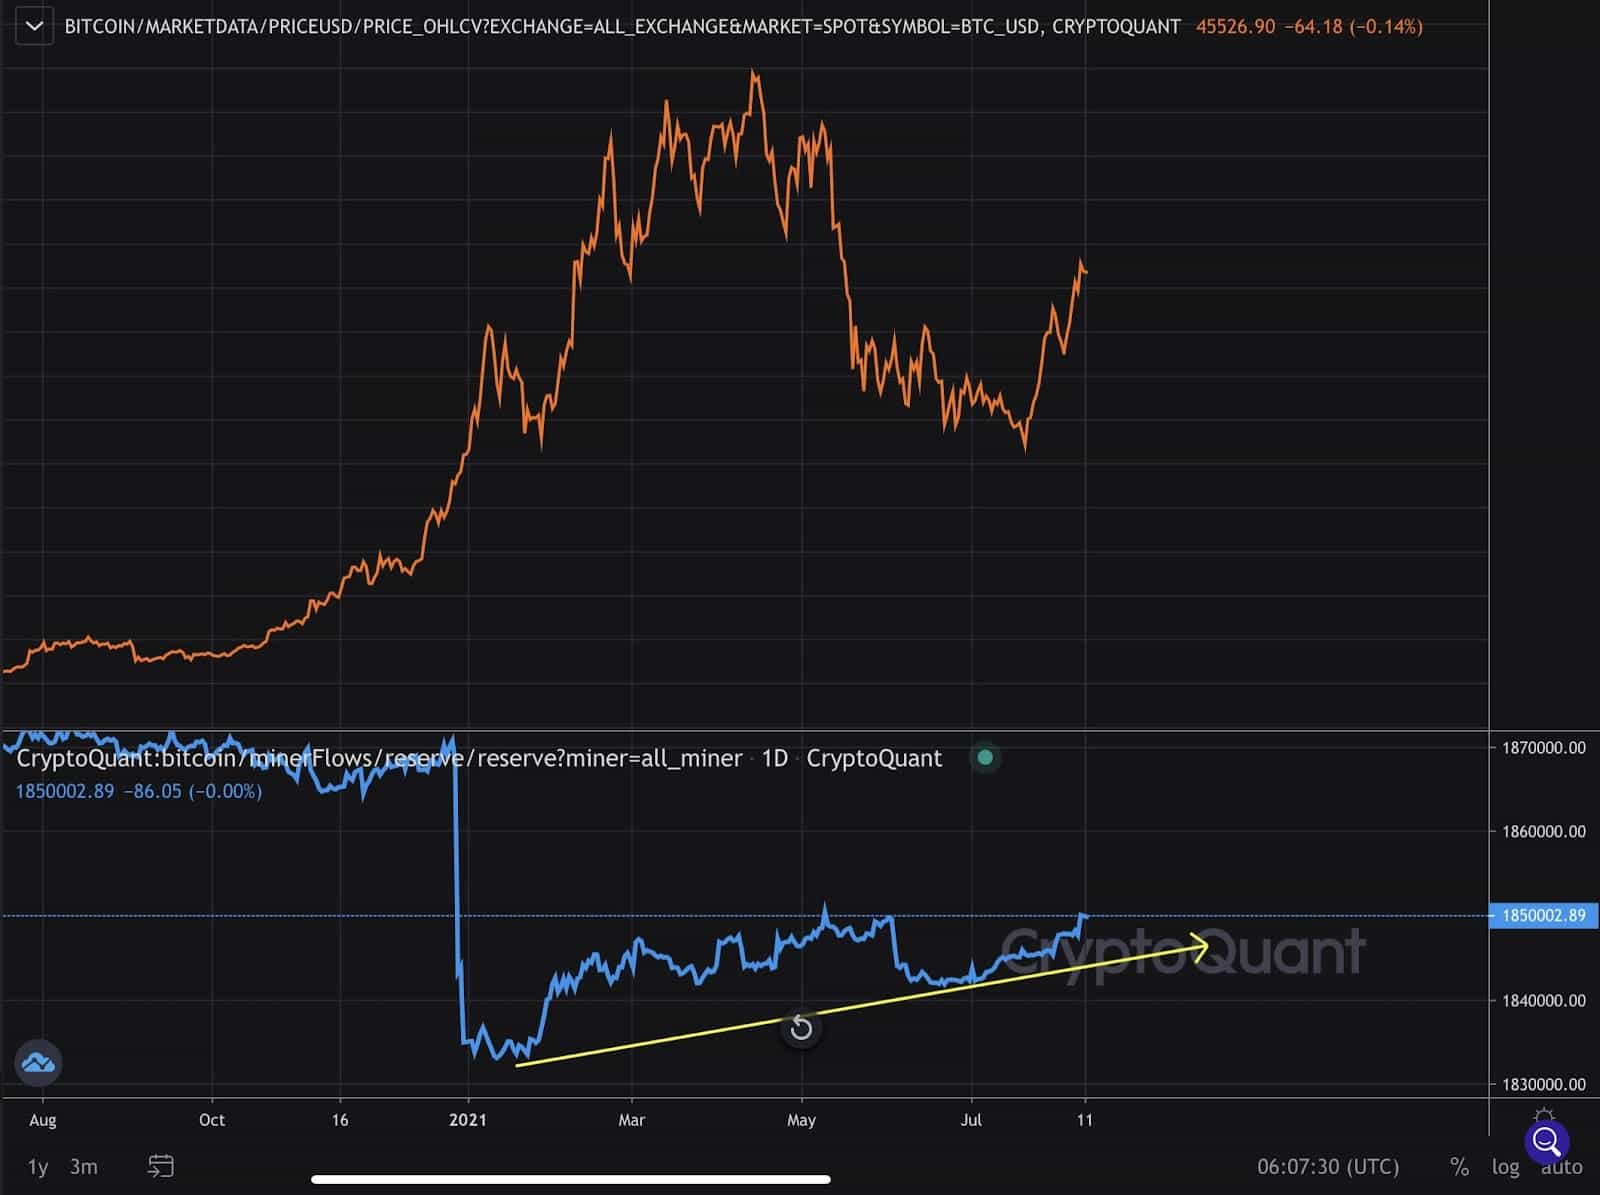
Another important part of the market to watch is BTC miners. They have been net accumulating BTC during this entire consolidation and early breakout phase. Additionally, the BTC hash ribbons indicator flashed a long-term buy signal, historically leading to very large rallies.

With cautious near-term technicals and BTC in a tight spot relative to the 200-day moving average, the aggregate data currently available paints a bullish outlook for the largest cryptocurrency. BTC bulls will be waiting for this week’s close for potential confirmation of the bull market continuation.


