Bitcoin Price Analysis: If Short-Term Bearishness Continues, This is the Level to Watch
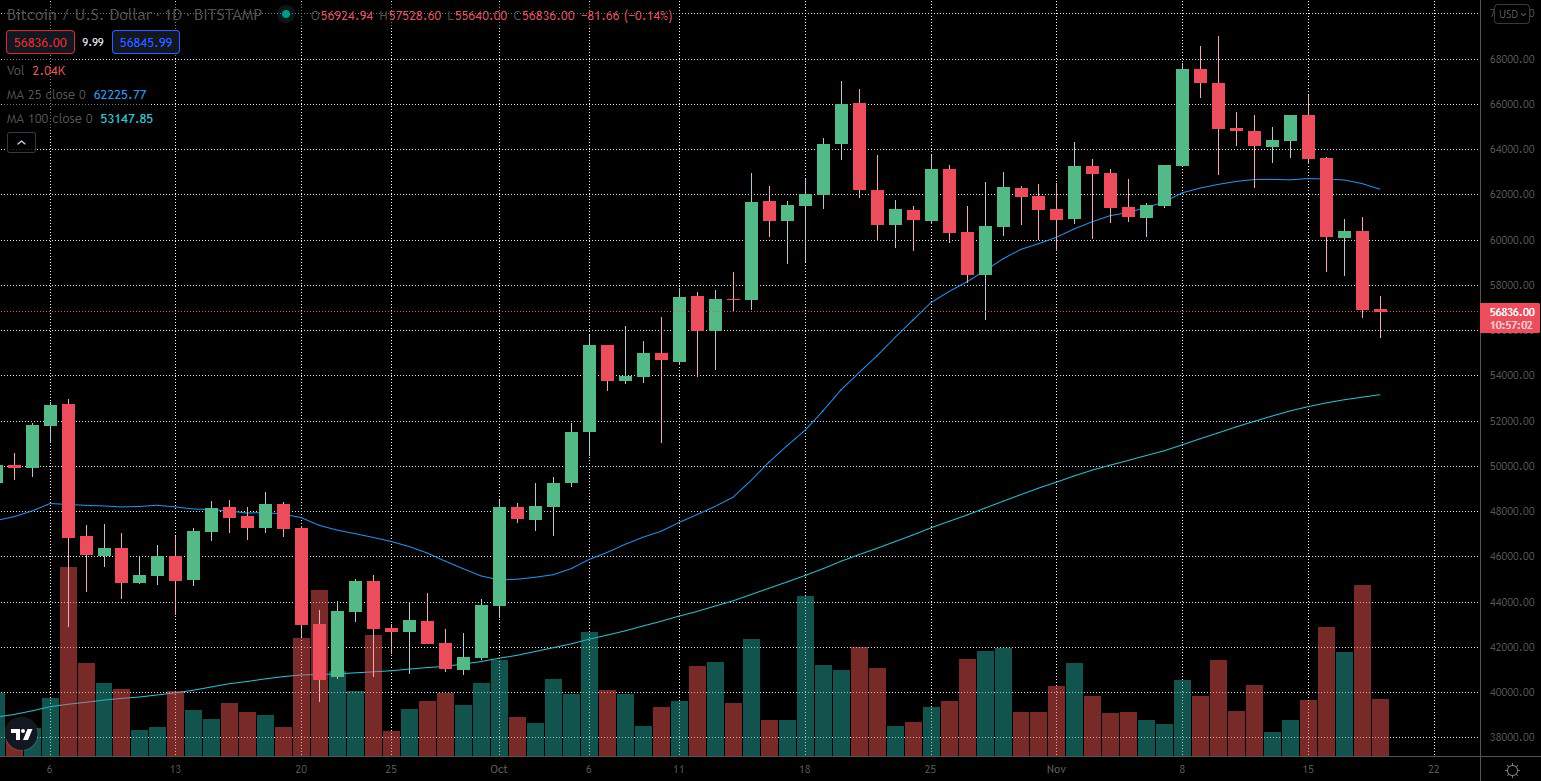
Bitcoin’s price dipped to an intraday low of $55,640 (on Bitstamp) and is currently down around 3.5% on the day and 11.8% on the week.
The entire market seems to be struggling, with an exception of cryptocurrencies associated with Play-to-Earn games and metaverse-related projects. Bitcoin managed to recover to about $57K, where it’s currently trading as the market is looking for the next direction.

The overall trend in fundamentals and on-chain remains firmly bullish despite this drawdown. Presently, the pressure seems to be coming from younger coins panic-selling at a loss and from liquidations of overleveraged long positions.
The near-term technicals signal for caution as there’s short-term bearish momentum in the market, and we need to wait for signs of a reversal. The support zone between $58.3K and $53K remains the one to be on the look for.
Older cohorts and miners are not selling aggressively throughout the current pullback, while the STH SOPR is below 1, which indicates that short-term holders (STHs) are realizing losses. The spot reserves are trending lower, but Binance reserves are trending higher.
The leverage ratio is still elevated at .20, and it’s good to be prepared for more liquidations just in case. It’s possible to see a wick down to $55K to $53K.
As we mentioned in our previous analysis, the zone between $58.3K and $53K seems like a good place to accumulate as the bull market still has plenty of upside according to on-chain and fundamental metrics.


