Bitcoin Price Analysis: Huge Price Move Coming Up? Yes, According To These Indicators
Before the weekend, we saw Bitcoin trading safely and easily on its way to $10,000. However, on our recent analysis two days ago, we had pointed out on some indicators that might put some bearish pressure on the cryptocurrency.
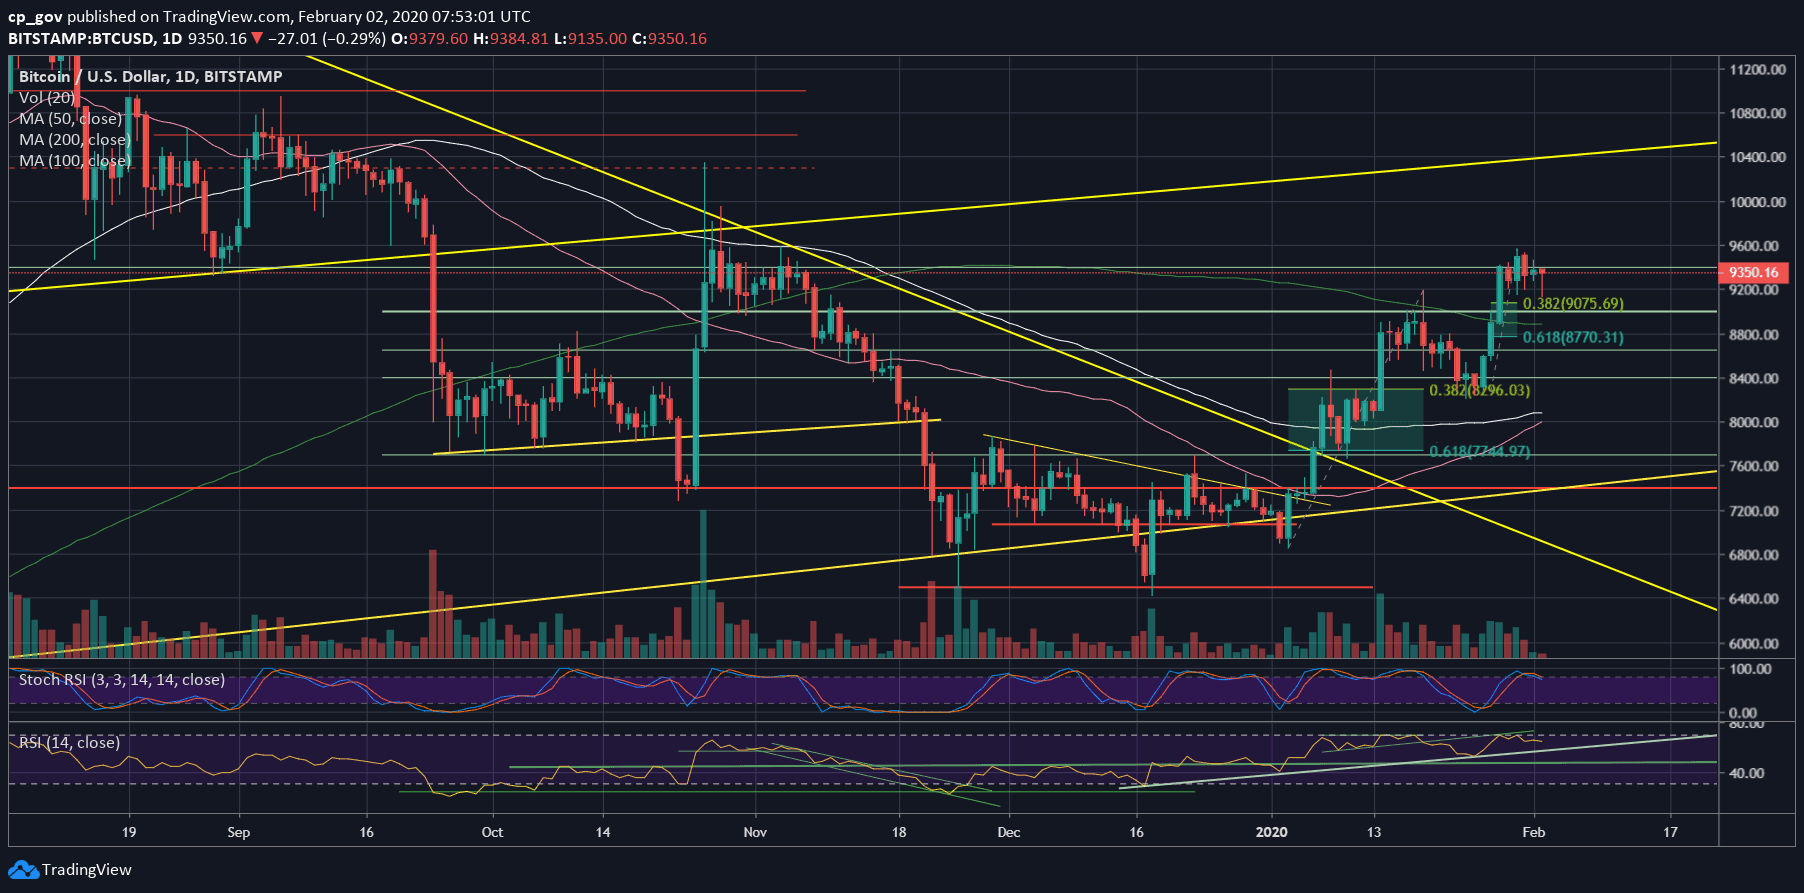
Since then, we saw a correction of almost $300 down to a current daily low of $9130 (Bitstamp rate). On the bigger time-frame, in case this correction doesn’t go lower, it seems very healthy for the short-term since this level is a little above the 38.2% Fibonacci retracement level of the recent bullish move.
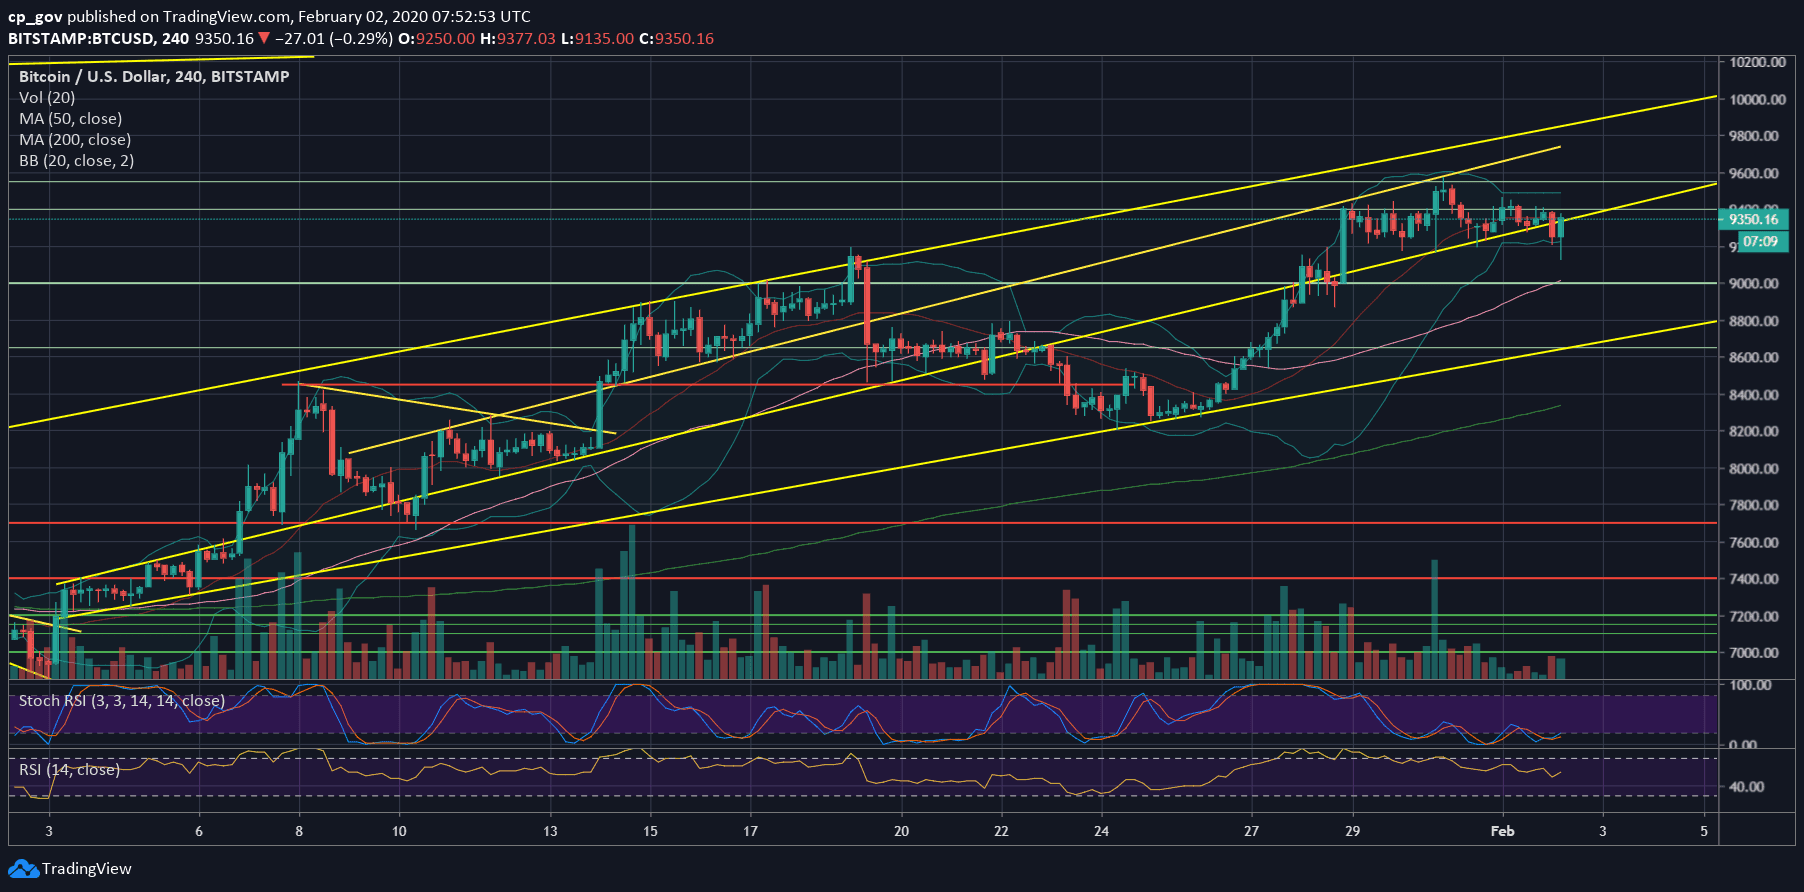
As of writing these lines, Bitcoin had recovered nicely, and now the coin is back again inside the $9300 – $9400 confluence price zone.
Overall, the short-term is still seeking for correction – unless the current 4-hour’s candle will close above the marked ascending trend-line (on the following chart, roughly around $9380); however, on the bigger time-frame, Bitcoin is on the right track North.
In any case, Bollinger Bands, along with the declining daily candles of trading volume are pointing on a possible huge price move which should be coming up in the next short term.
Golden Cross Coming-up?
Looking on the daily chart, we can see a longer-term bullish sign reaching out to take place in the coming days: A Golden Cross between the 50 and the 100 moving average lines. This indicator, which is usually lagging, is an important momentum indicator, and it happens as the MA-50 (marked by pink line) crosses above the MA-100 (white line).
This is the “little brother” of the Golden Cross by definition, between the MA-50 and the MA-200 (the light green line, currently around $8900). If Bitcoin continues its bullish track, we might see this kind of cross in the next 1-2 months.
Total Market Cap: $259.2 billion
Bitcoin Market Cap: $170 billion
BTC Dominance Index: 65.7%
*Data by CoinGecko
Key Levels To Watch & Next Targets
– Support/Resistance levels: Bitcoin is now back again at the confluence zone between $9300 – $9400. Failing to hold this level, and the 4-hour’s ascending trend-line will trigger a further correction. The first level of support might be $9200, before the $9075 which is the 38.2% Fibonacci retracement level of the recent bullish move.
Down below lies $9000 and $8900, along with the significant 200-days moving average line. Further below is the Golden Fib level – 61.8% – at $8770.
From the bullish side, the first level of resistance is the $9450 area (a recent top) before the 2020 high at $9550 – $9570. Further above lies the $9800 old resistance zone along with the top-ascending trend-line as shown on the 4-hour chart.
– The RSI Indicator: As we pointed out here on the previous price analysis, the bearish divergence had resulted in a $300 correction (so far, as of today).
Overall, the RSI seems to have some more room to go lower, along with the Stochastic RSI oscillator that had recently gone through a bearish cross-over and now just entered the neutral territory. This might trigger a deeper correction.
– Trading volume: For almost a week, the volume is declining. This might reveal a more significant price move is coming up soon, as the new trading week would start tomorrow (Monday).
BTC/USD BitStamp 4-Hour Chart

BTC/USD BitStamp 1-Day Chart

The post Bitcoin Price Analysis: Huge Price Move Coming Up? Yes, According To These Indicators appeared first on CryptoPotato.


