Bitcoin Price Analysis: Huge Move Anticipated As BTC Forming a Symmetrical Triangle On The Lower Timeframe
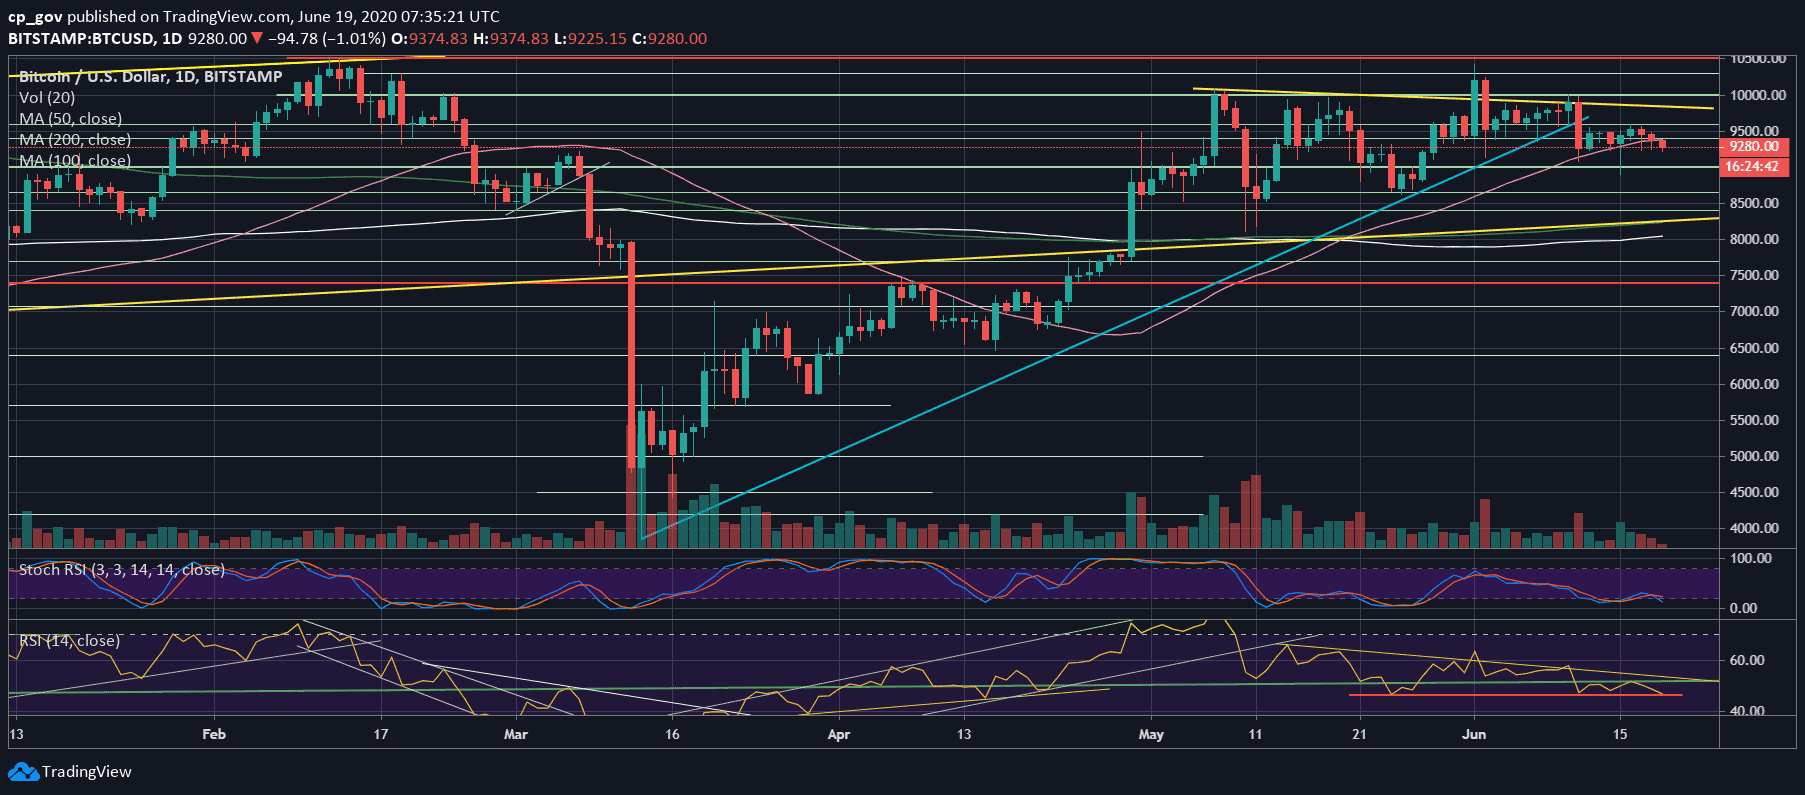
Over the past days, Bitcoin price was mainly trading around the $9400 mark, following the MA-50 pink line of both the attached 4-hour chart and the daily.
This dull sideways action had started a week ago, and despite a little glitch below $9200, we can say that the trading range had been $9200 – $9500, which is quite stable for a currency like Bitcoin.
What’s Next?
As history taught us, Bitcoin does not like staying at one spot for a long while. We do anticipate a wild move to take place, probably during the upcoming weekend.
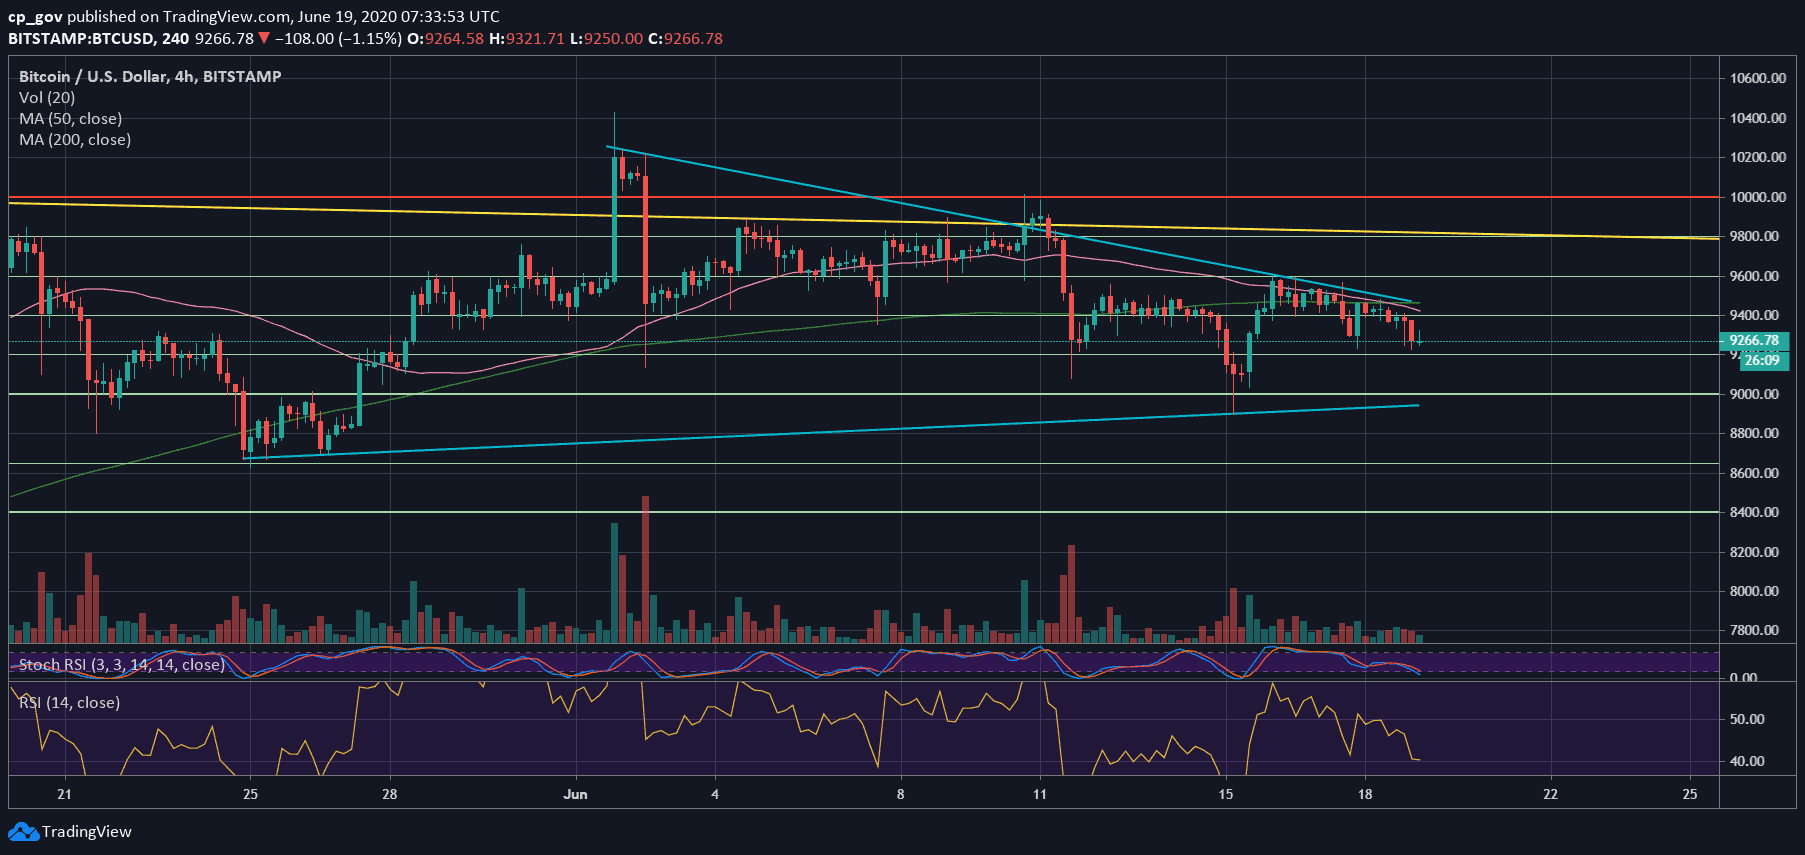
Looking at the 4-hour chart, we can see that Bitcoin is forming a symmetrical triangle. This emphasizes the tight range the price is consolidating through, along with the fact that both scenarios – the bullish and the bearish are valid.
Looking at the trading volume, the past two days were among the lowest volume days since March.
The daily RSI also consolidates and currently fighting for the horizontal line of 46. A bullish sign will be a break back above the 50 – 52 area.
Bitcoin’s Short-term Support and Resistance Levels
From above, the first significant resistance now lies at $9400, along with the 50-days moving average line (the pink line).
Further above lies $9600, which is the highest price from the past 7 days. Further above lies the yellow descending trend-line, currently around $9800 – $9850.
From below, the first support level lies at $9230, which is the lowest price from the past four days. Further below lies the $8900 – $9000 area, which is also this week’s low.
Total Market Cap: $263 billion
Bitcoin Market Cap: $171.3 billion
BTC Dominance Index: 65.0%
*Data by CoinGecko
BTC/USD BitStamp 4-Hour Chart
BTC/USD BitStamp 1-Day Chart
The post Bitcoin Price Analysis: Huge Move Anticipated As BTC Forming a Symmetrical Triangle On The Lower Timeframe appeared first on CryptoPotato.