Bitcoin Price Analysis: How Likely is for BTC to Break Above $100K This Week?
Bitcoin is struggling to regain momentum, with its price action stagnating around the 100-day moving average. The current market structure suggests a pivotal moment, where a bullish rebound remains a strong possibility.
Technical Analysis
By Shayan
The Daily Chart
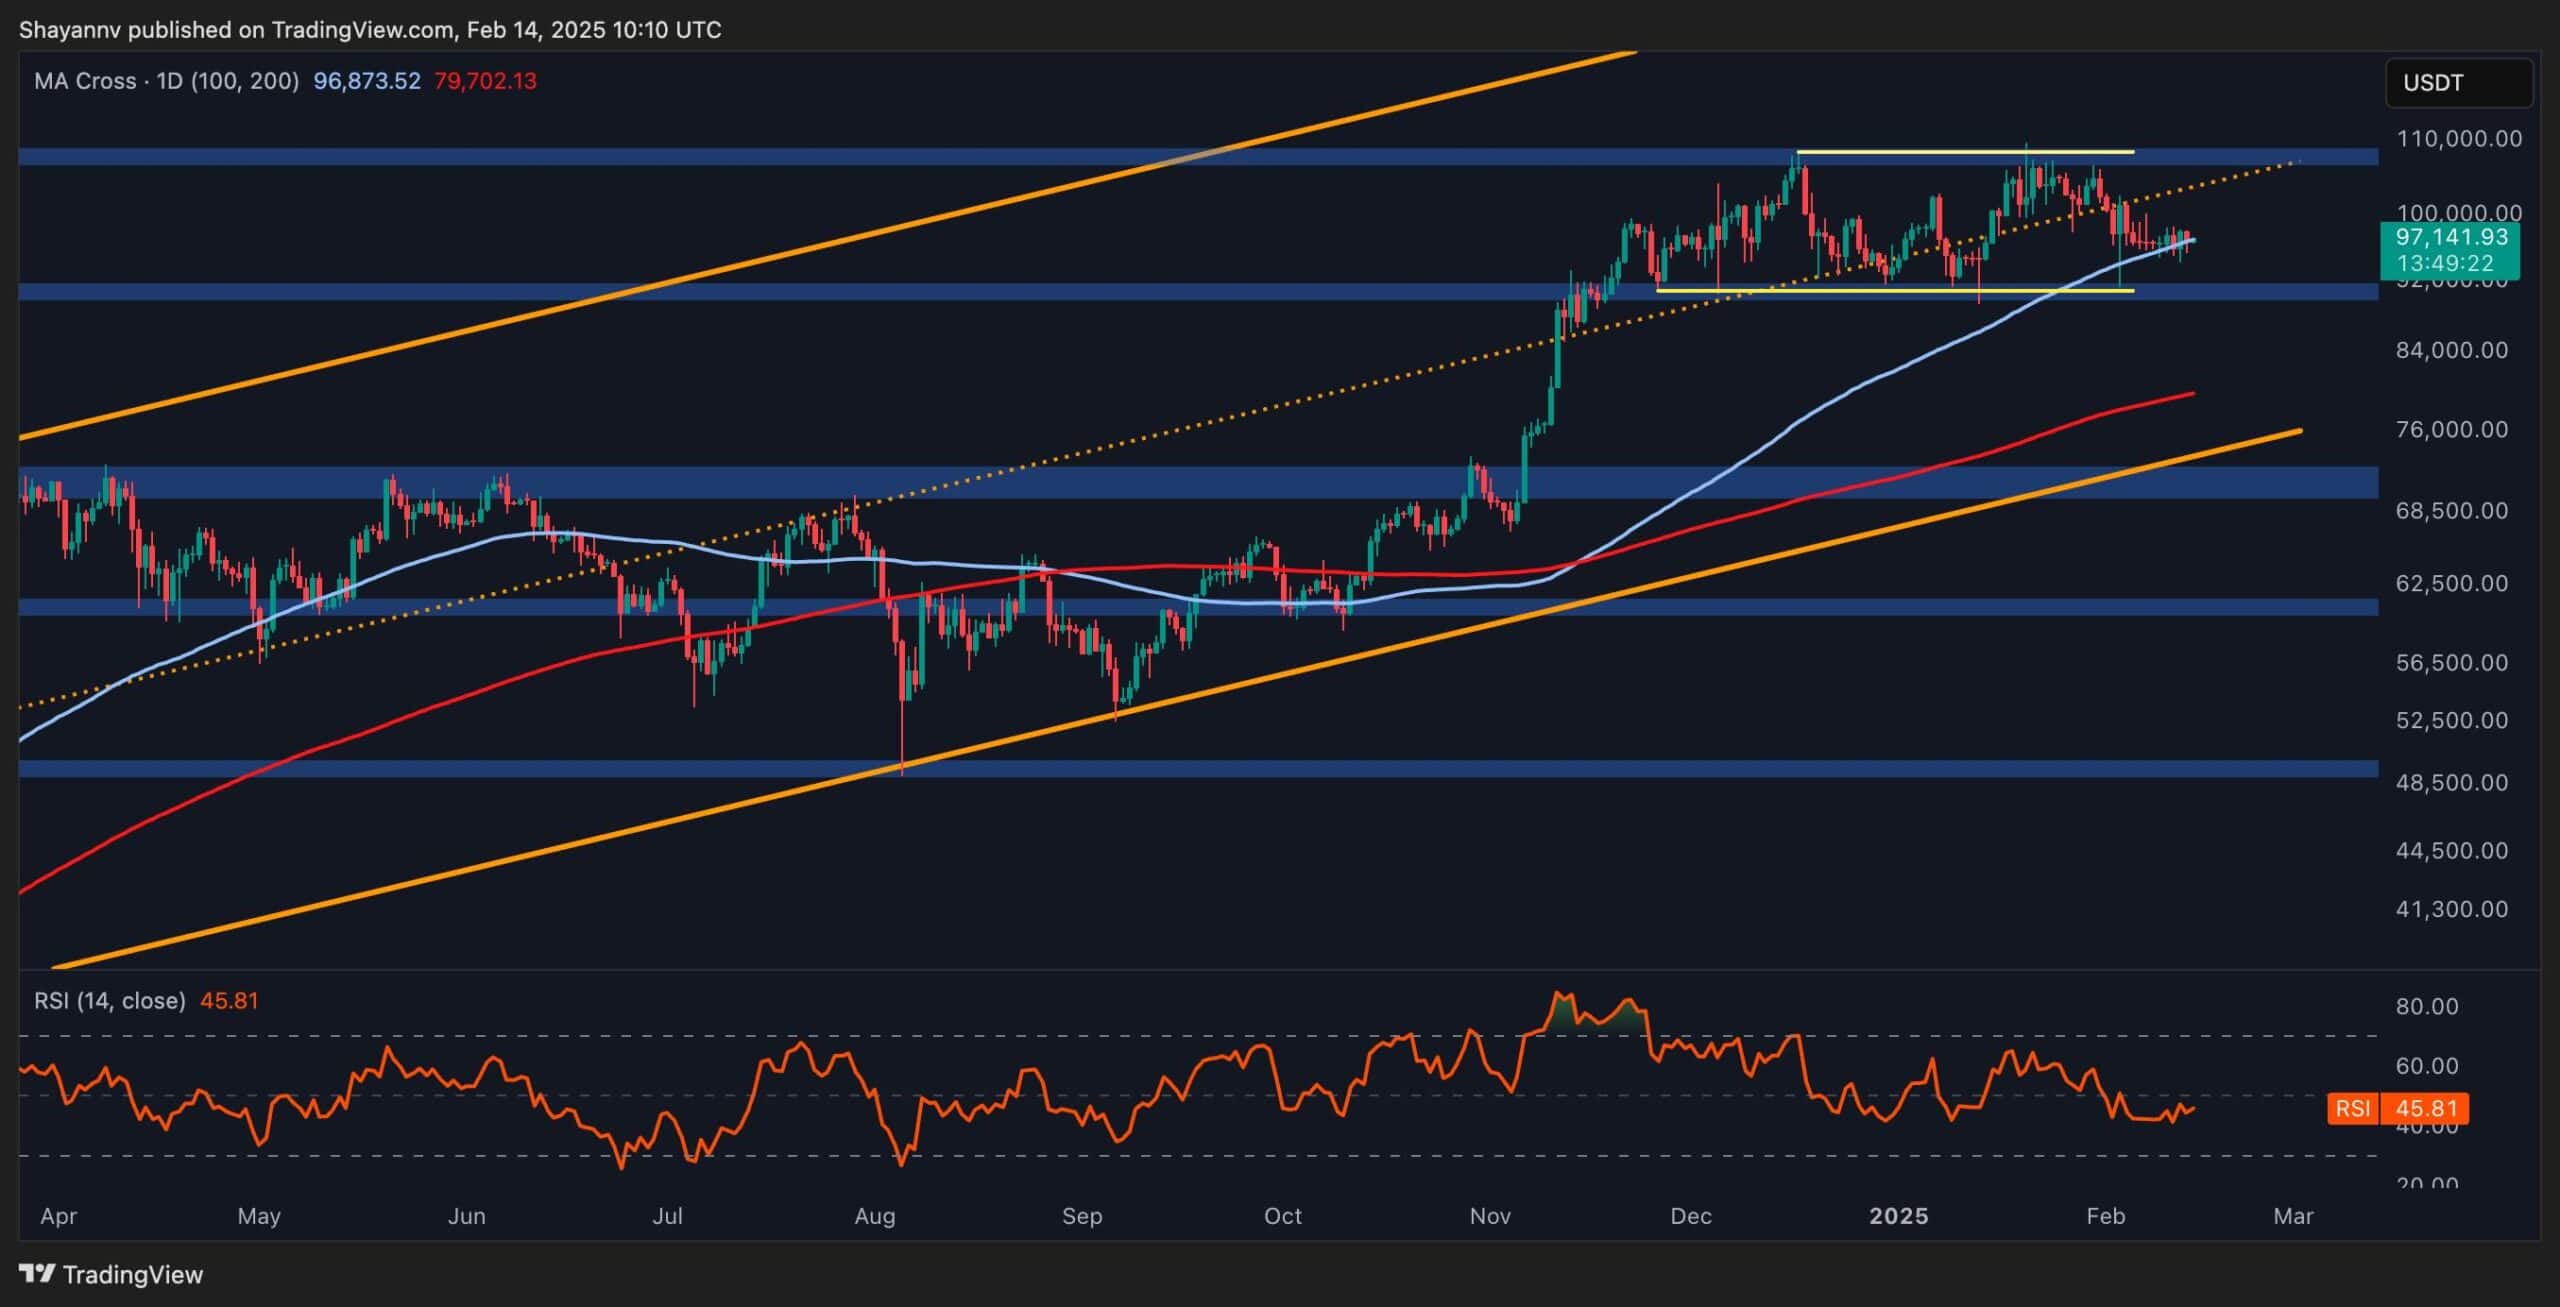
Bitcoin’s price has been consolidating near the crucial 100-day moving average at $96K, with sellers attempting to push it below this key support. A decisive breakdown could trigger a deeper correction toward the substantial $90K support in the coming weeks.
On the flip side, if buyers defend this critical zone and initiate a rebound, an upward move toward the $100K psychological resistance becomes increasingly likely. The RSI hovers near the neutral 50 mark, signaling a balance between bulls and bears, with a breakout in either direction determining the next trend.
The 4-Hour Chart
Zooming into the 4-hour timeframe, Bitcoin’s price action remains within a large bullish flag pattern. Currently, the price is hovering just above the pattern’s lower boundary, a key level that must hold to sustain the bullish outlook. If support remains intact, the market could witness a breakout above the upper trendline, paving the way for a continuation of the uptrend.
However, a failure to hold this level could accelerate selling pressure, potentially dragging the price toward the $90K mark or lower. Until a breakout occurs, traders should prepare for heightened volatility and cautious market movement.

On-chain Analysis
By Shayan
Bitcoin’s prolonged consolidation near all-time highs can largely be attributed to substantial profit-taking by long-term investors. This trend is evident in the Long-Term Holder SOPR metric, which measures the profitability of coins held for over six months.
The 30-day moving average of the Long-Term Holder SOPR suggests that long-term investors have been actively selling their holdings to secure profits. This selling pressure has played a significant role in Bitcoin’s struggle to extend its rally. However, it’s worth noting that these profit-taking levels remain lower than those observed last summer when Bitcoin was trading at lower price levels.
If selling pressure eases, Bitcoin could gain the necessary momentum for a new leg higher, potentially breaking out of its current consolidation phase and aiming for new all-time highs.

The post Bitcoin Price Analysis: How Likely is for BTC to Break Above $100K This Week? appeared first on CryptoPotato.