Bitcoin Price Analysis: How High Can BTC Go After the $10K Breakout?
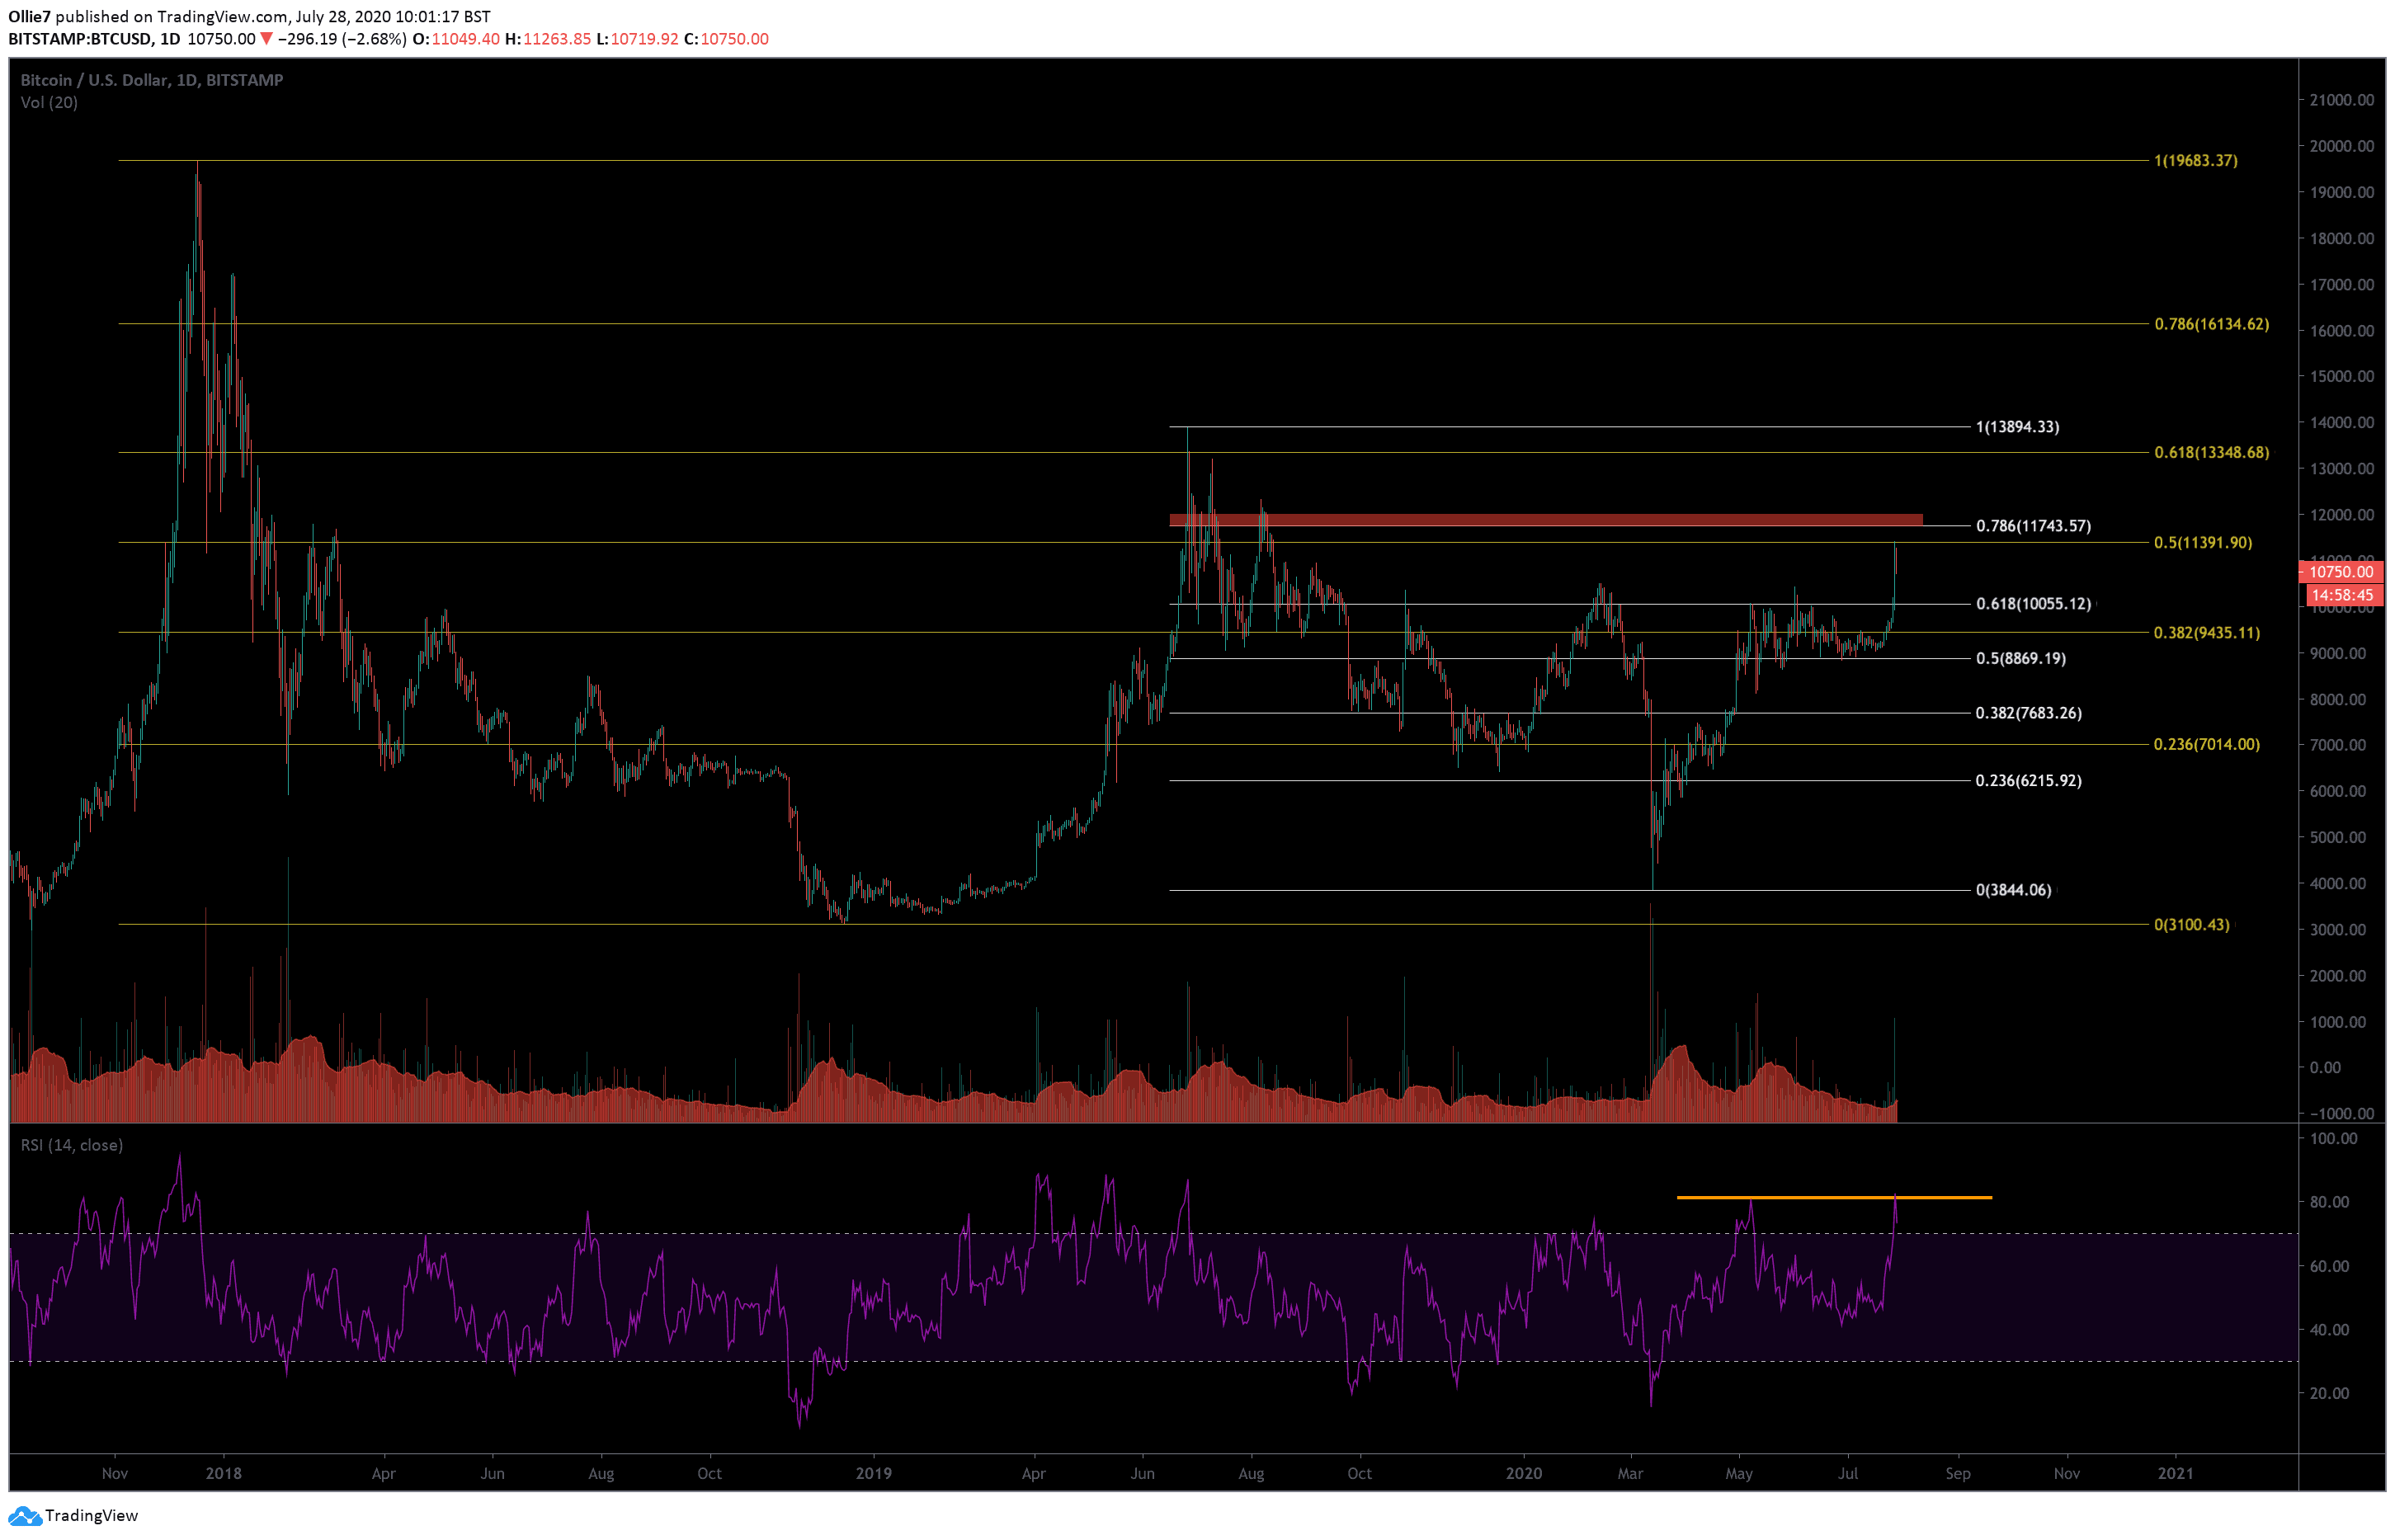
Bitcoin bulls appear to be resting right now after ricocheting off a major Fibonacci resistance at $11,390 (yellow Fibonacci levels on the daily chart).
This is the first time this level has been testing in almost a year and is one of the major hurdles standing in the way of BTC prices breaking above the psychological $12,000 mark.
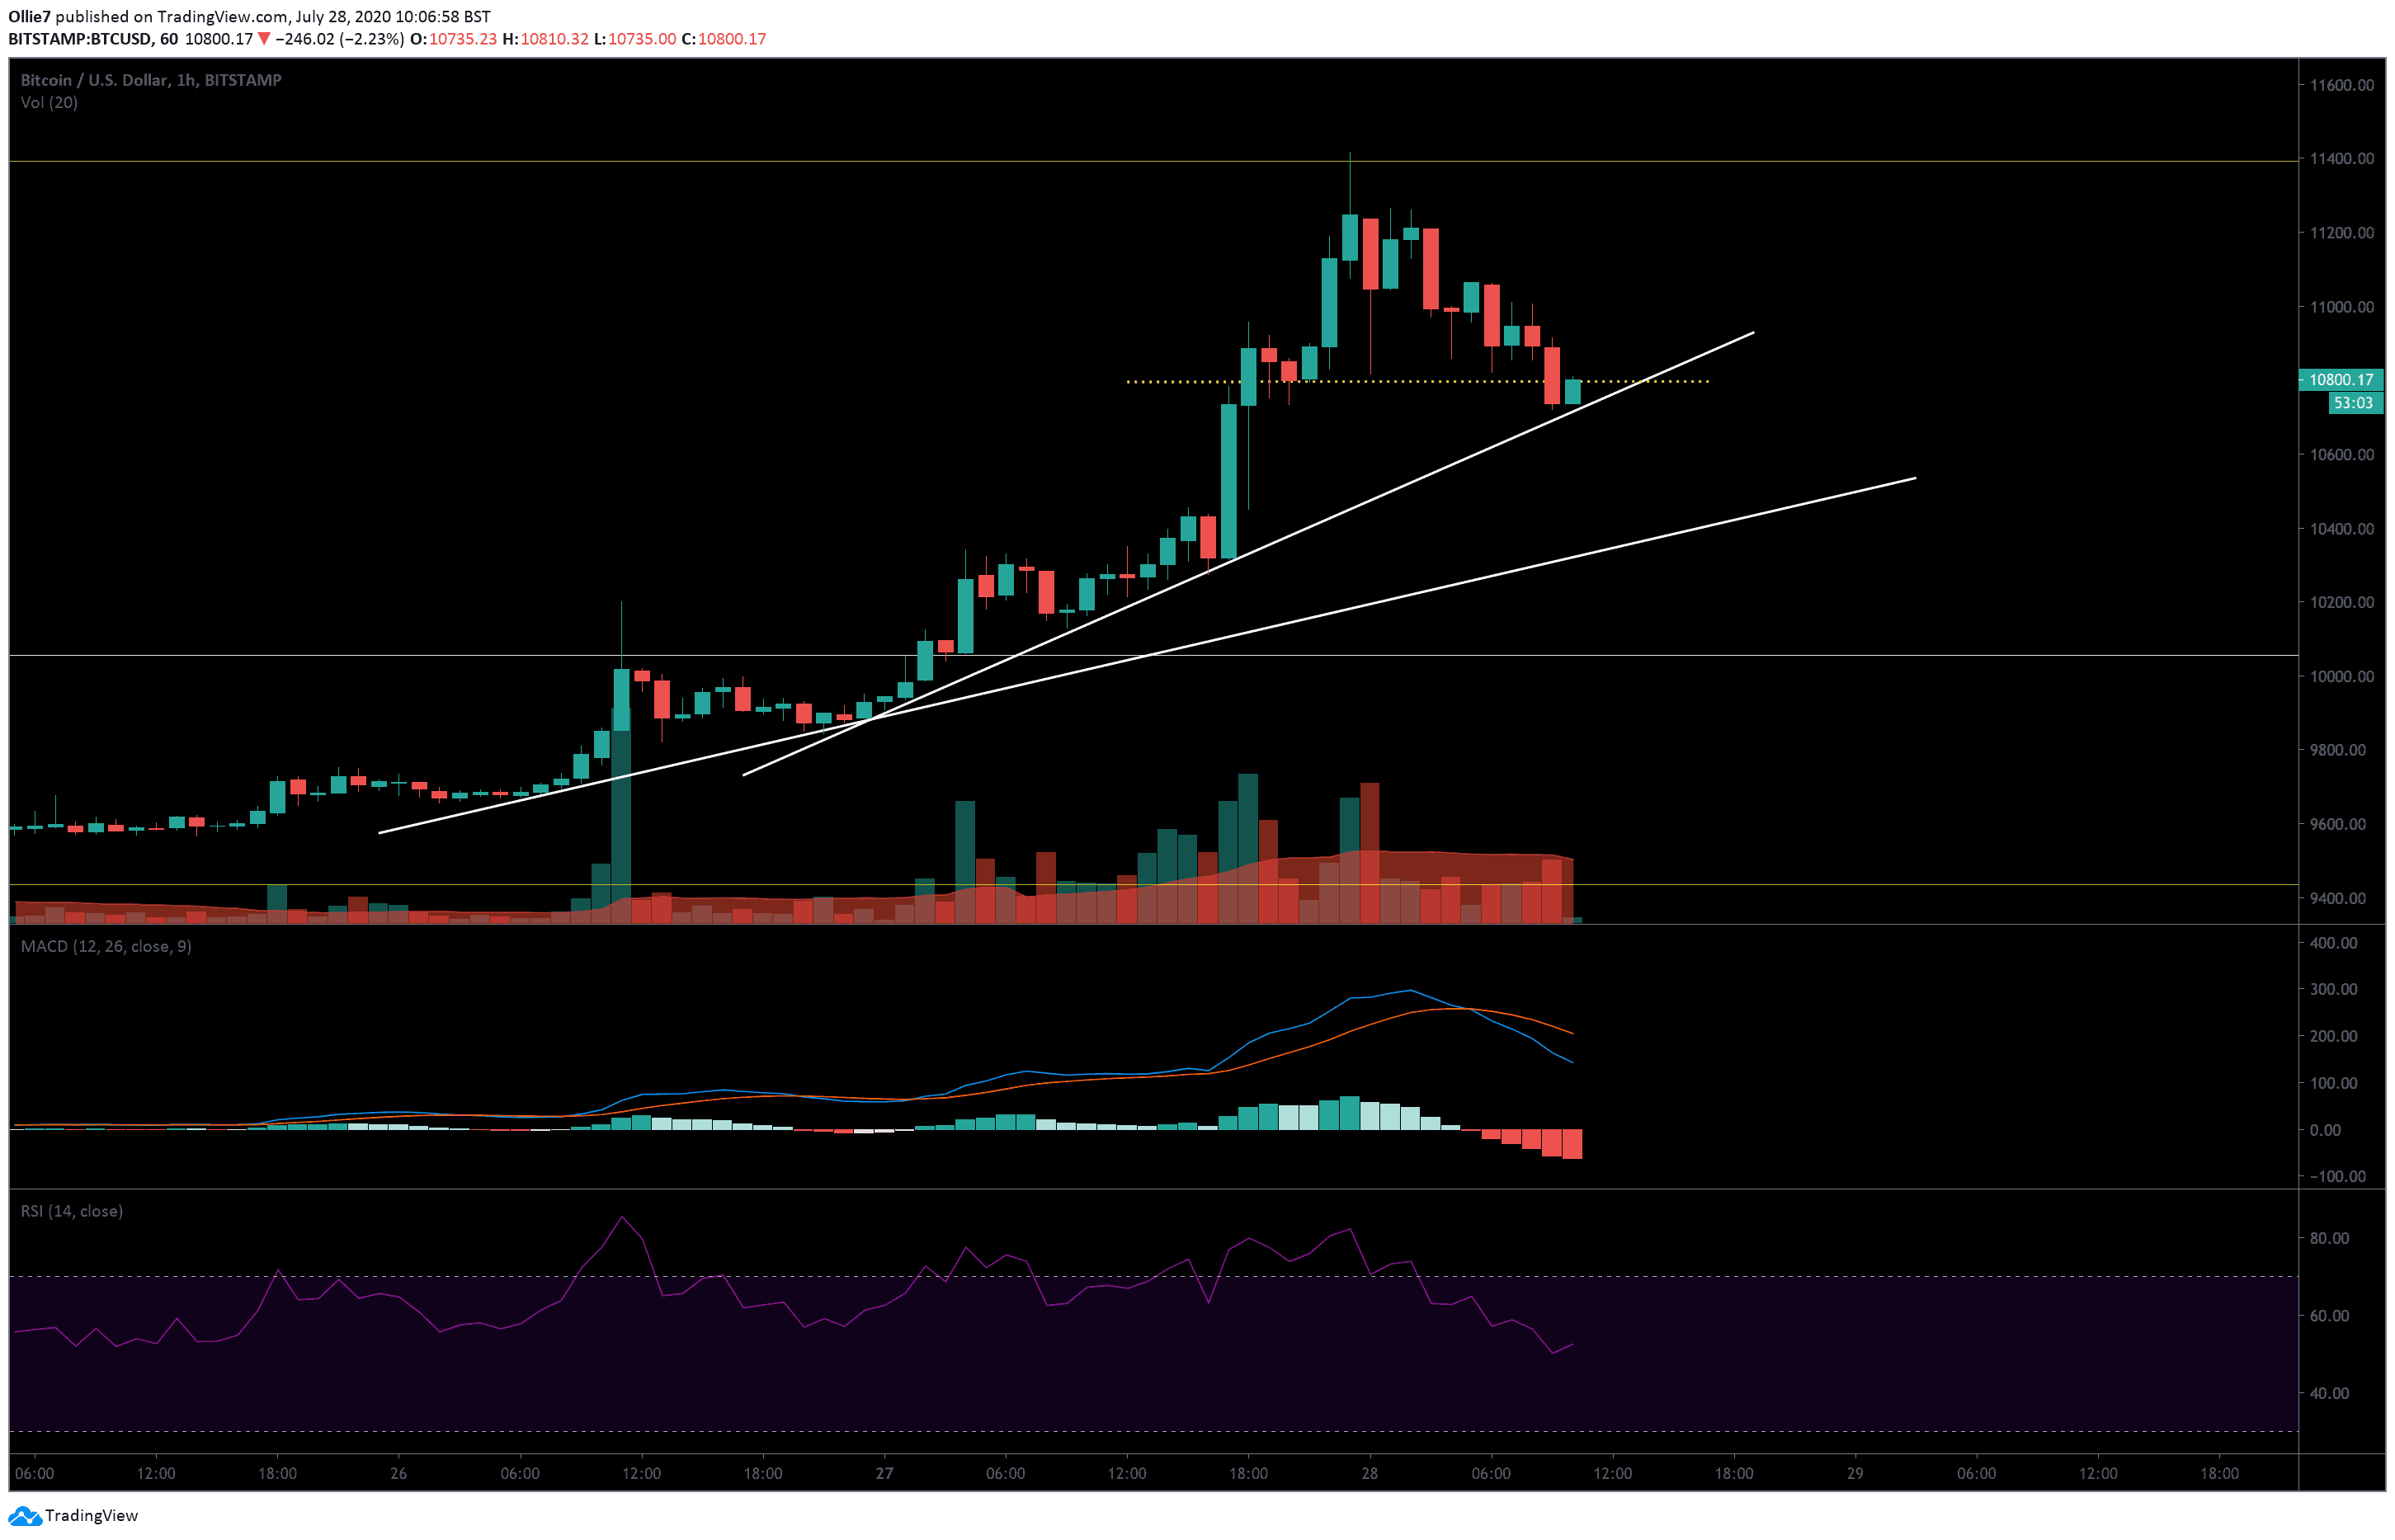
On the 1-Hour BTC/USD Bitstamp chart, we can see that up-trending momentum has stalled. Could this an early sign of a bearish reversal, or are bulls just recharging before they make another strong move?
The Technicals
On the daily BTC/USD chart, we can see that the leading crypto is wildly overbought right now on the RSI. This is usually a strong indication that a correction is due.
The last time bitcoin was overbought on the daily RSI was back on May 11, right before prices tanked 19% over three days.
On the 4-Hour MACD, it’s showing that buying volume is falling on the histogram. The 12-day moving average is also starting to arc down towards the 26-day moving average. If these two lines converge, it could be construed as an early signal of a short-term bearish reversal.
While this may all seem favorably bearish, it should be noted that the global crypto market capital has recently set a new higher high above $300 billion. This tends to be an excellent sign that we have entered into a bull market, at least in short to mid-term.
Price Levels to Watch in the Short-term
Right now, the aforementioned 0.5 Fibonacci level (yellow) at approx $11,400, is the first major target for bullish traders. This is followed by a historically key weekly resistance at $11,490, and then the psychological $12,000 target above.
Looking at the 1-Hour chart (below), we can see that the $10,798 level (yellow dotted line) is creating some intraday resistance for bullish traders. The price is, however, being supported by one of two up-trending supports (see white lines on 1H chart).
The first support is keeping bitcoin above $10,730. If this fails, then we could see prices tumble down to the second uptrending line approximately near the $10,400 mark (depending on when it breaks and meets the line).
Beneath that, we have the 0.618 Fibonacci level (white line) at $10,055, which could provide a foothold for bulls to rebound from if bears try to take over.
BTC/USD Bitstamp Daily Chart
BTC/USD Bitstamp 1-Hour Chart
The post Bitcoin Price Analysis: How High Can BTC Go After the $10K Breakout? appeared first on CryptoPotato.