Bitcoin Price Analysis: How Deep Will This Correction Be as BTC Slumps by $4K?
Bitcoin’s price came just a small step away from reaching the $100K milestone.
The market has been rallying aggressively following the US election, as buying Bitcoin has been one of the most profitable Trump trades. However, the cryptocurrency has retraced and is now further away from its six-digit target.
Technical Analysis
By Edris Derakhshi (TradingRage)
The Daily Chart
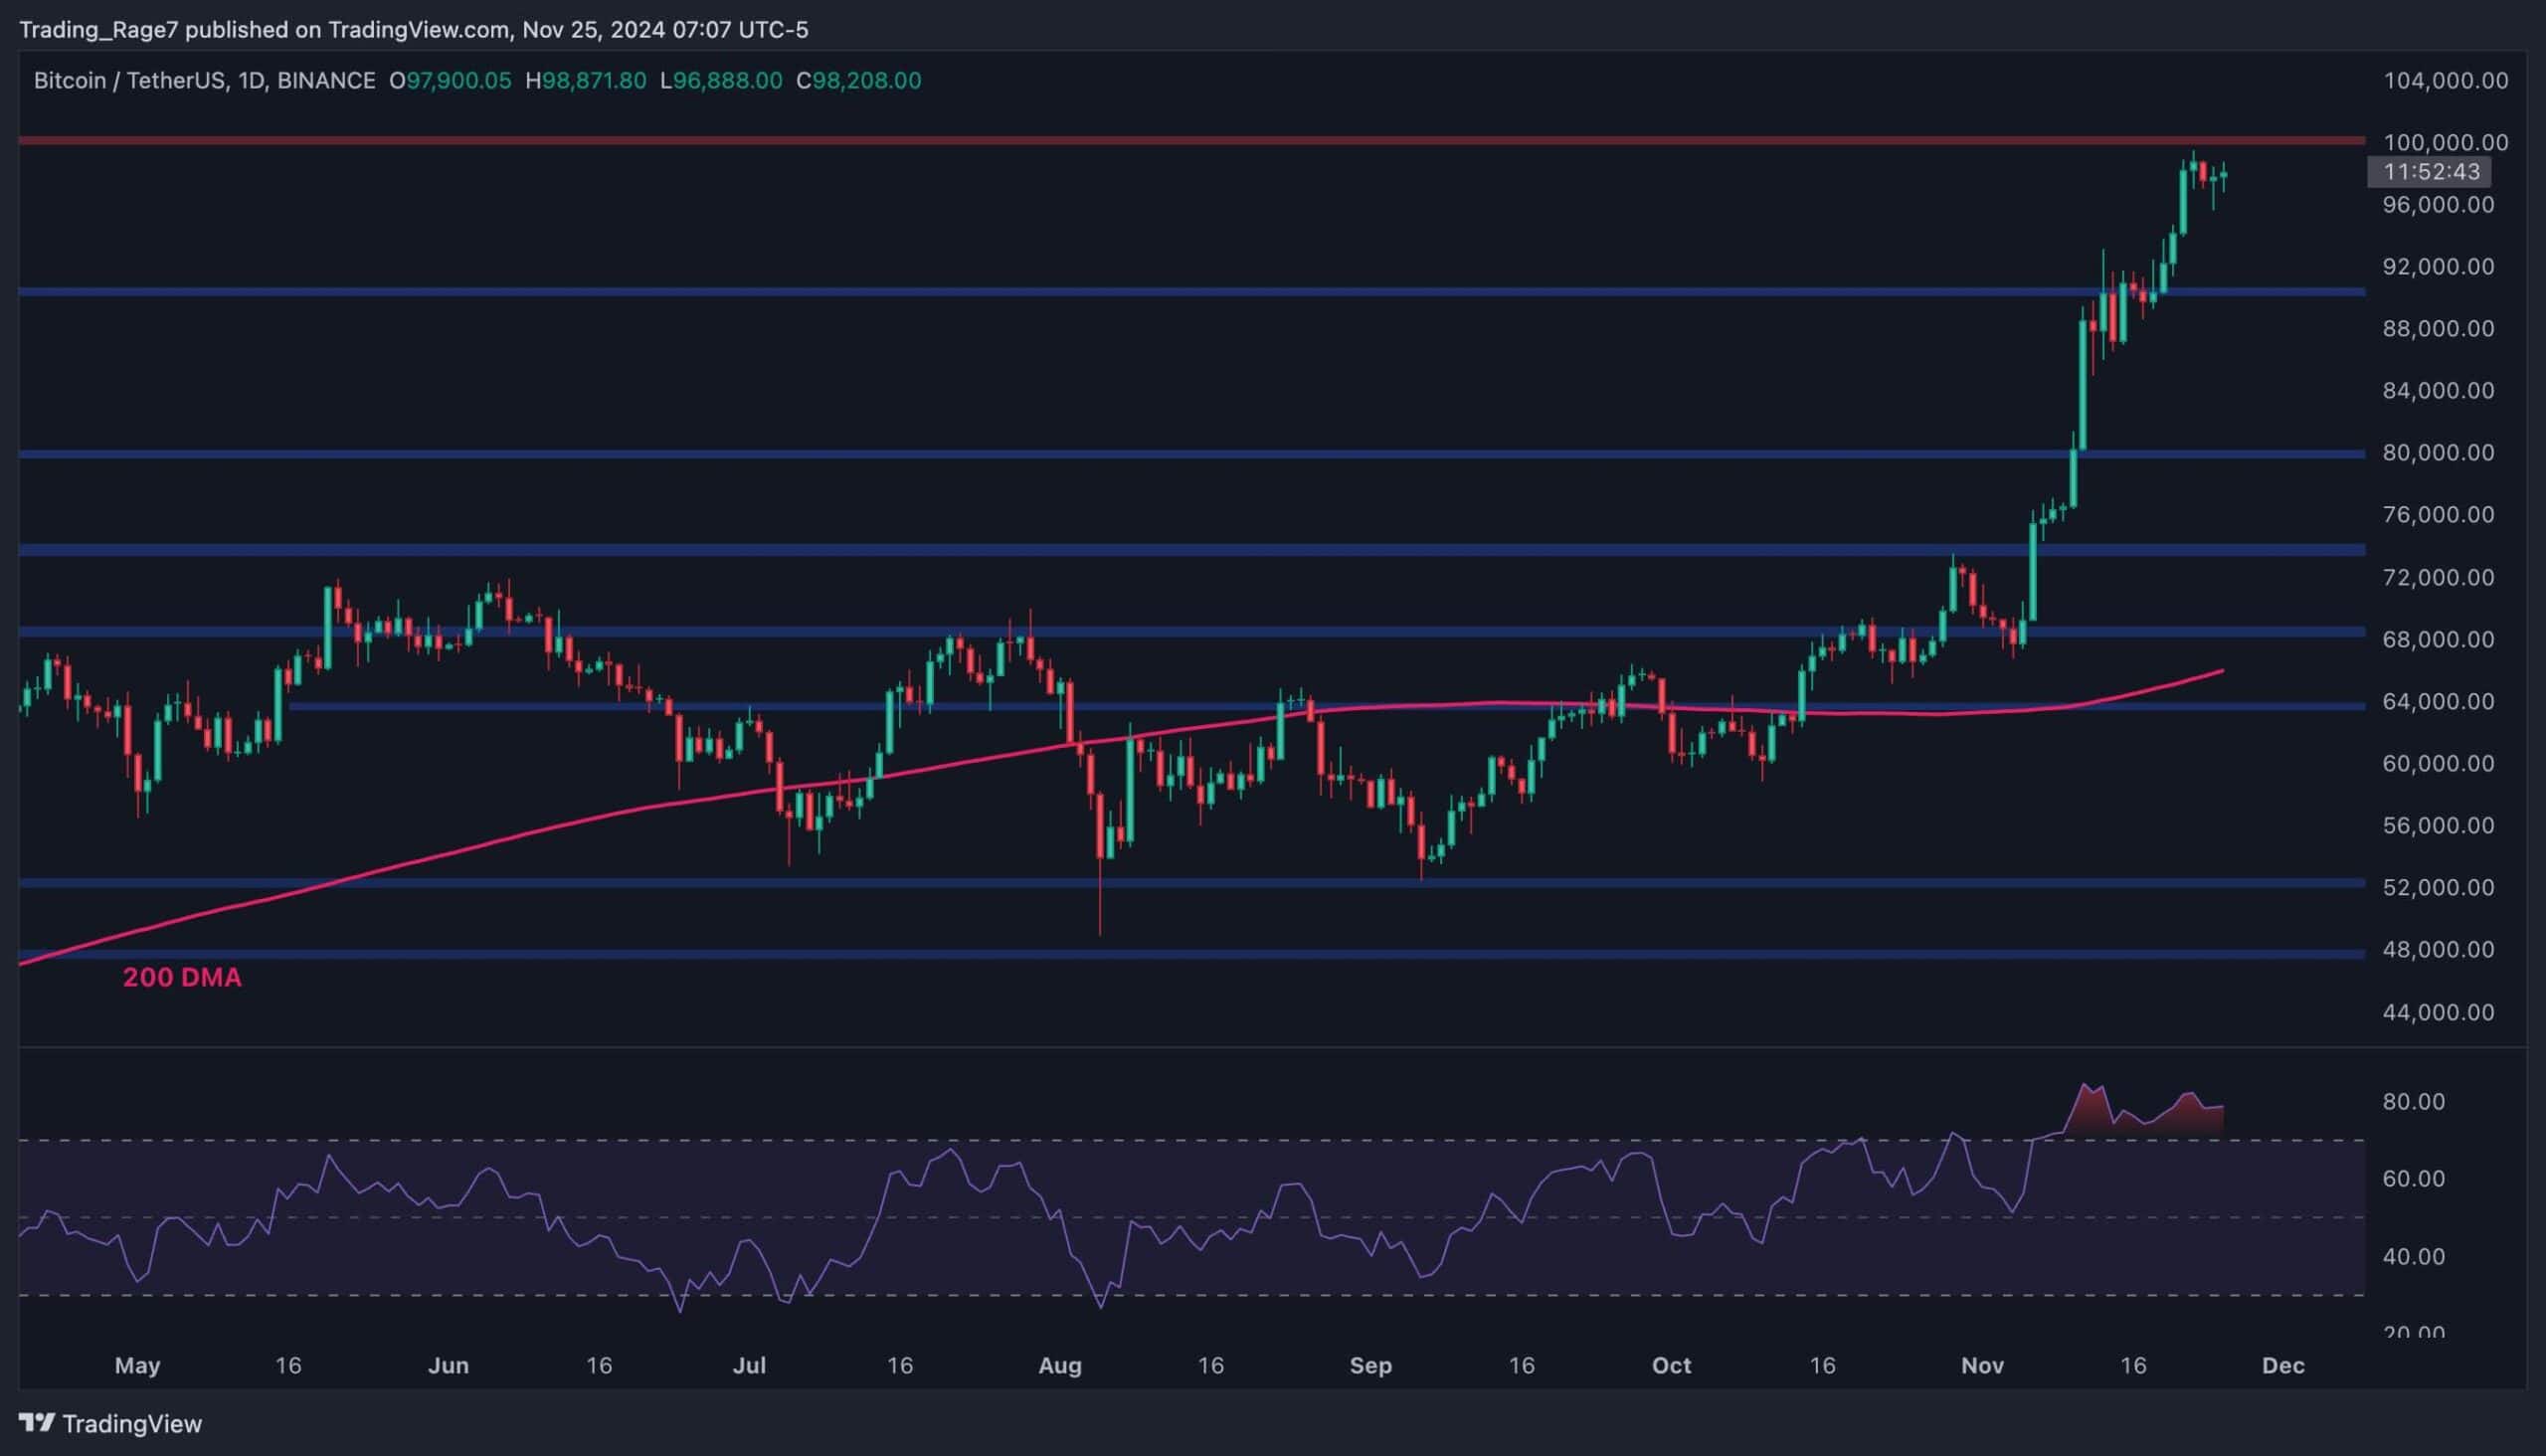
On the daily chart, the price has been surging almost vertically since early November, and 100K BTC is likely to be witnessed soon. There is no significant observation that can be made based only on the price action. However, the RSI has been showing a massive overbought signal for a while now.
This could indicate that while Bitcoin is likely to hit $100K in the short term, there’s also a considerable possibility for a correction or consolidation afterward.
The 4-Hour Chart
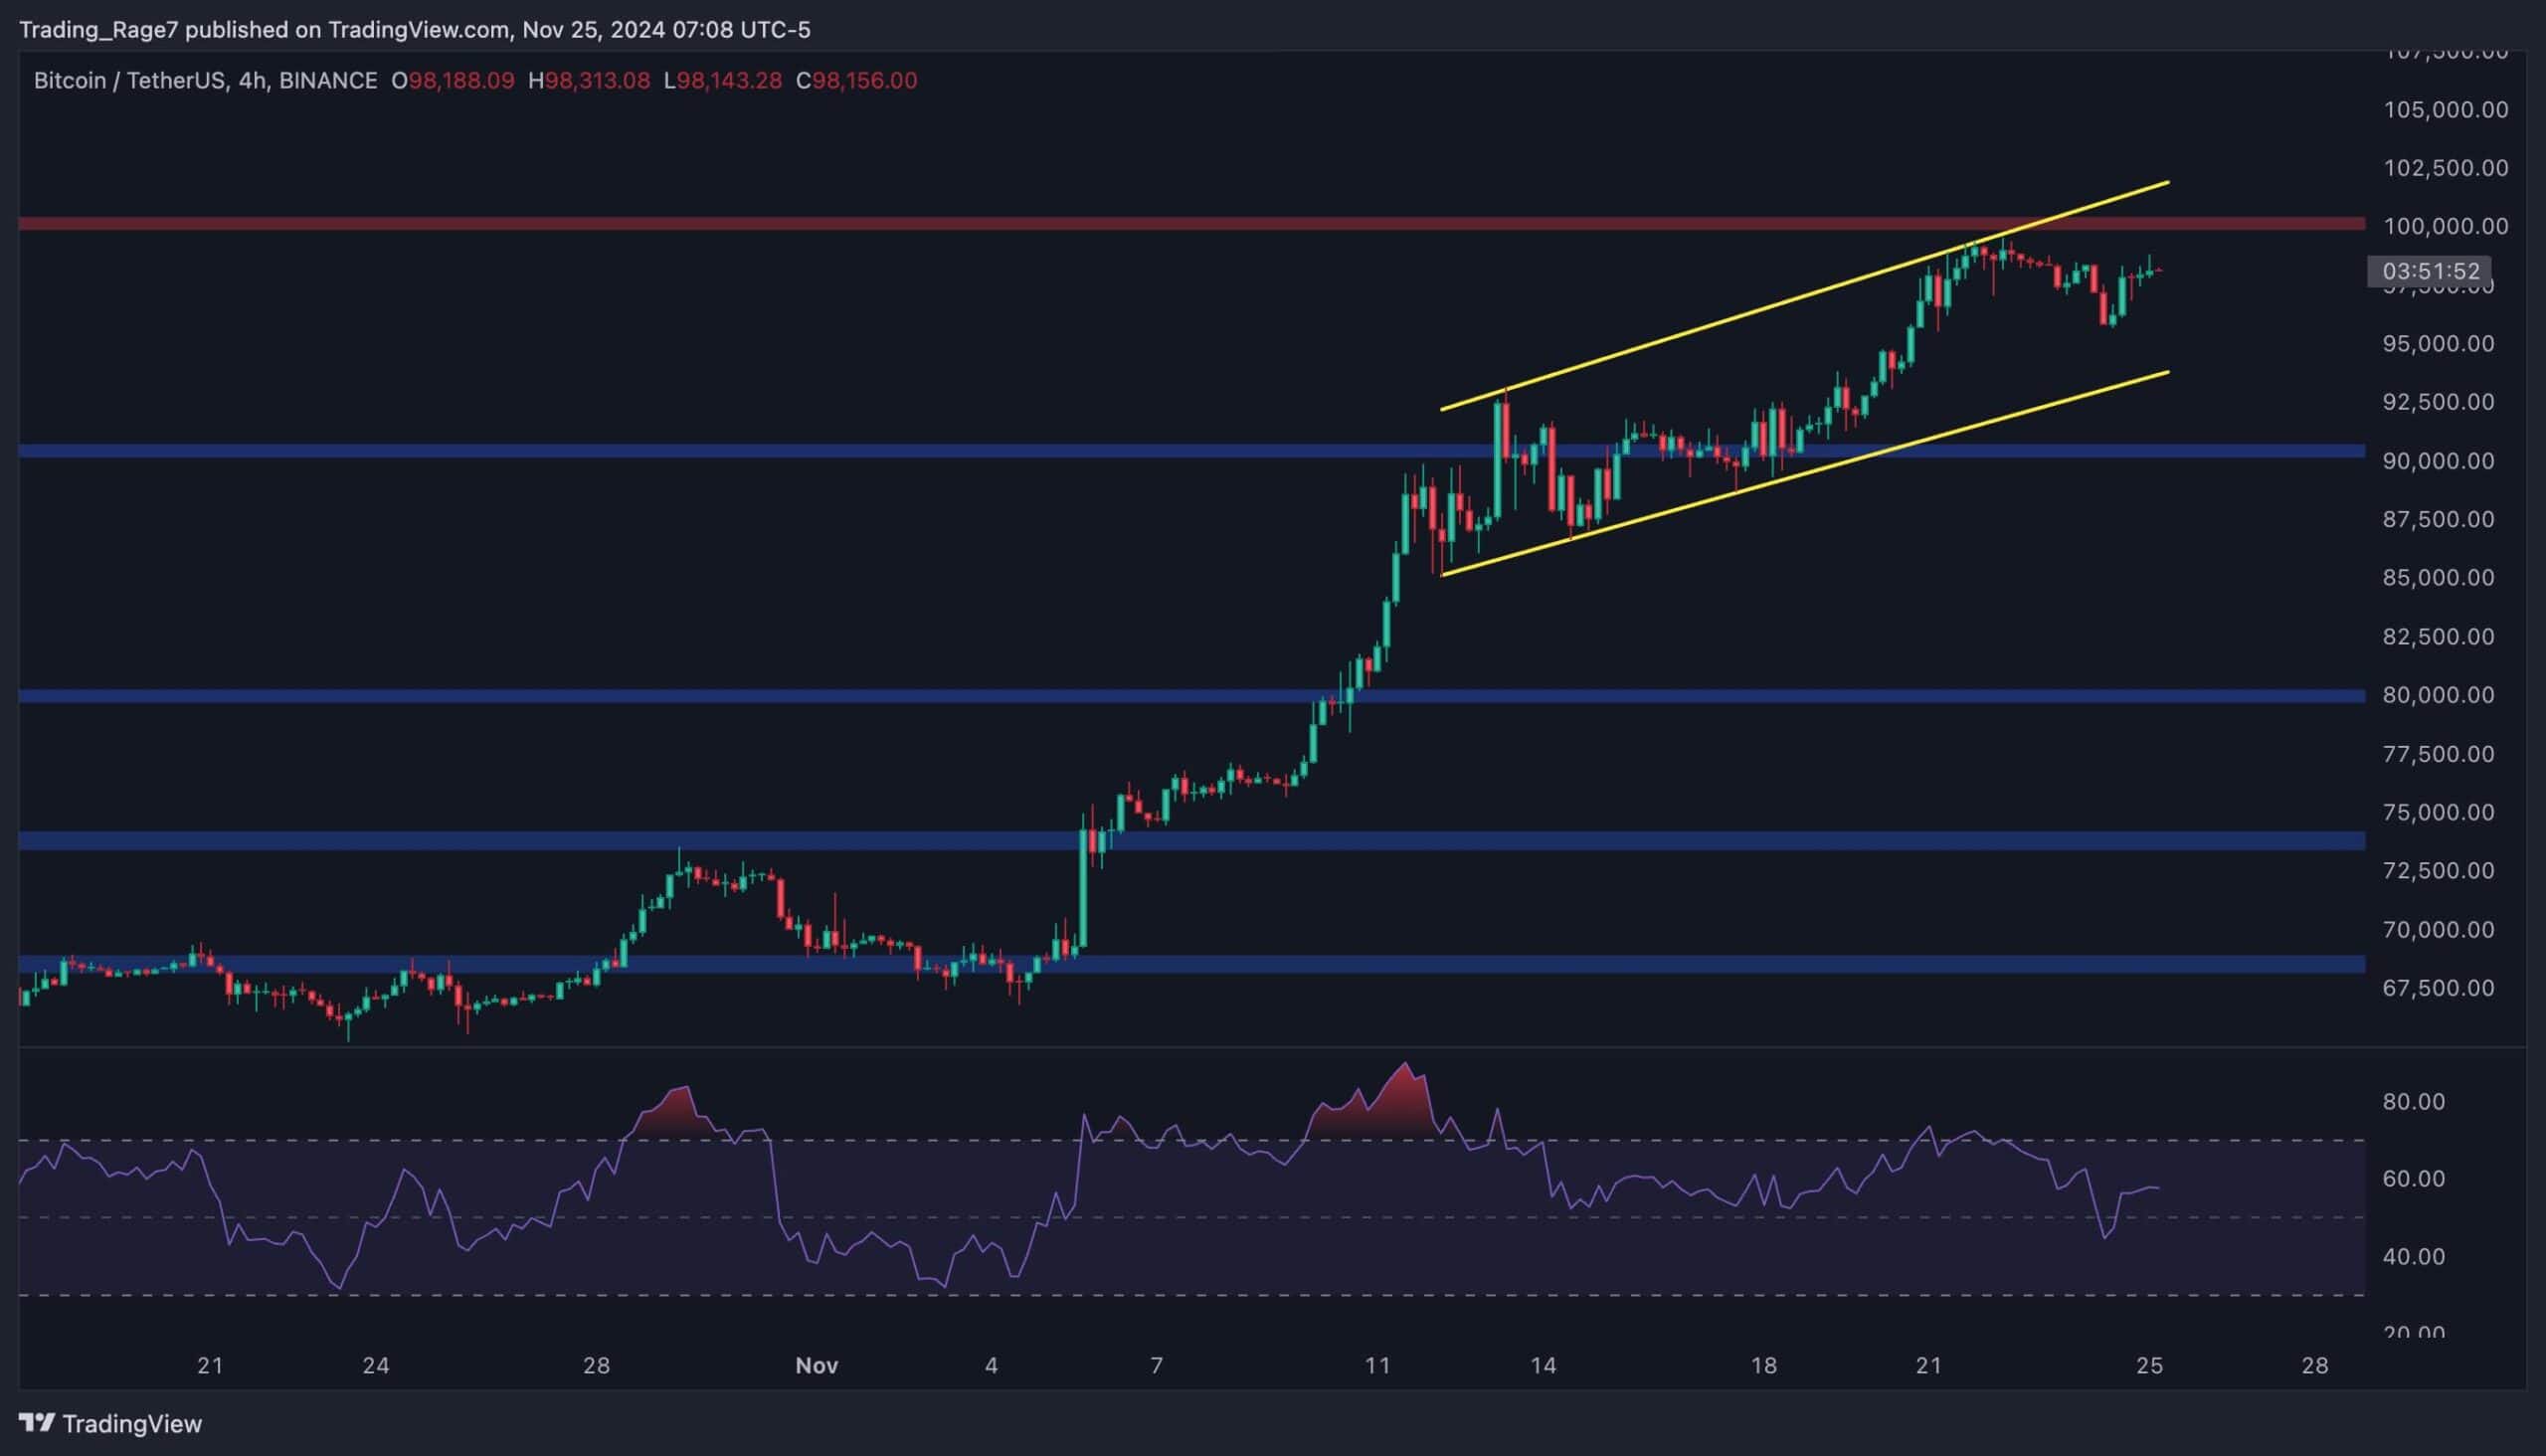
Looking at the 4-hour chart, things seem to align with a possible correction scenario, as the price has been gradually rising inside an ascending channel over the past couple of weeks. Paired with a clear bearish divergence shown by the RSI, a correction seems probable.
Yet, any potential pullback will likely occur after the market has broken through the $100K level.

On-Chain Analysis
By Edris Derakhshi (TradingRage)
Exchange Reserve
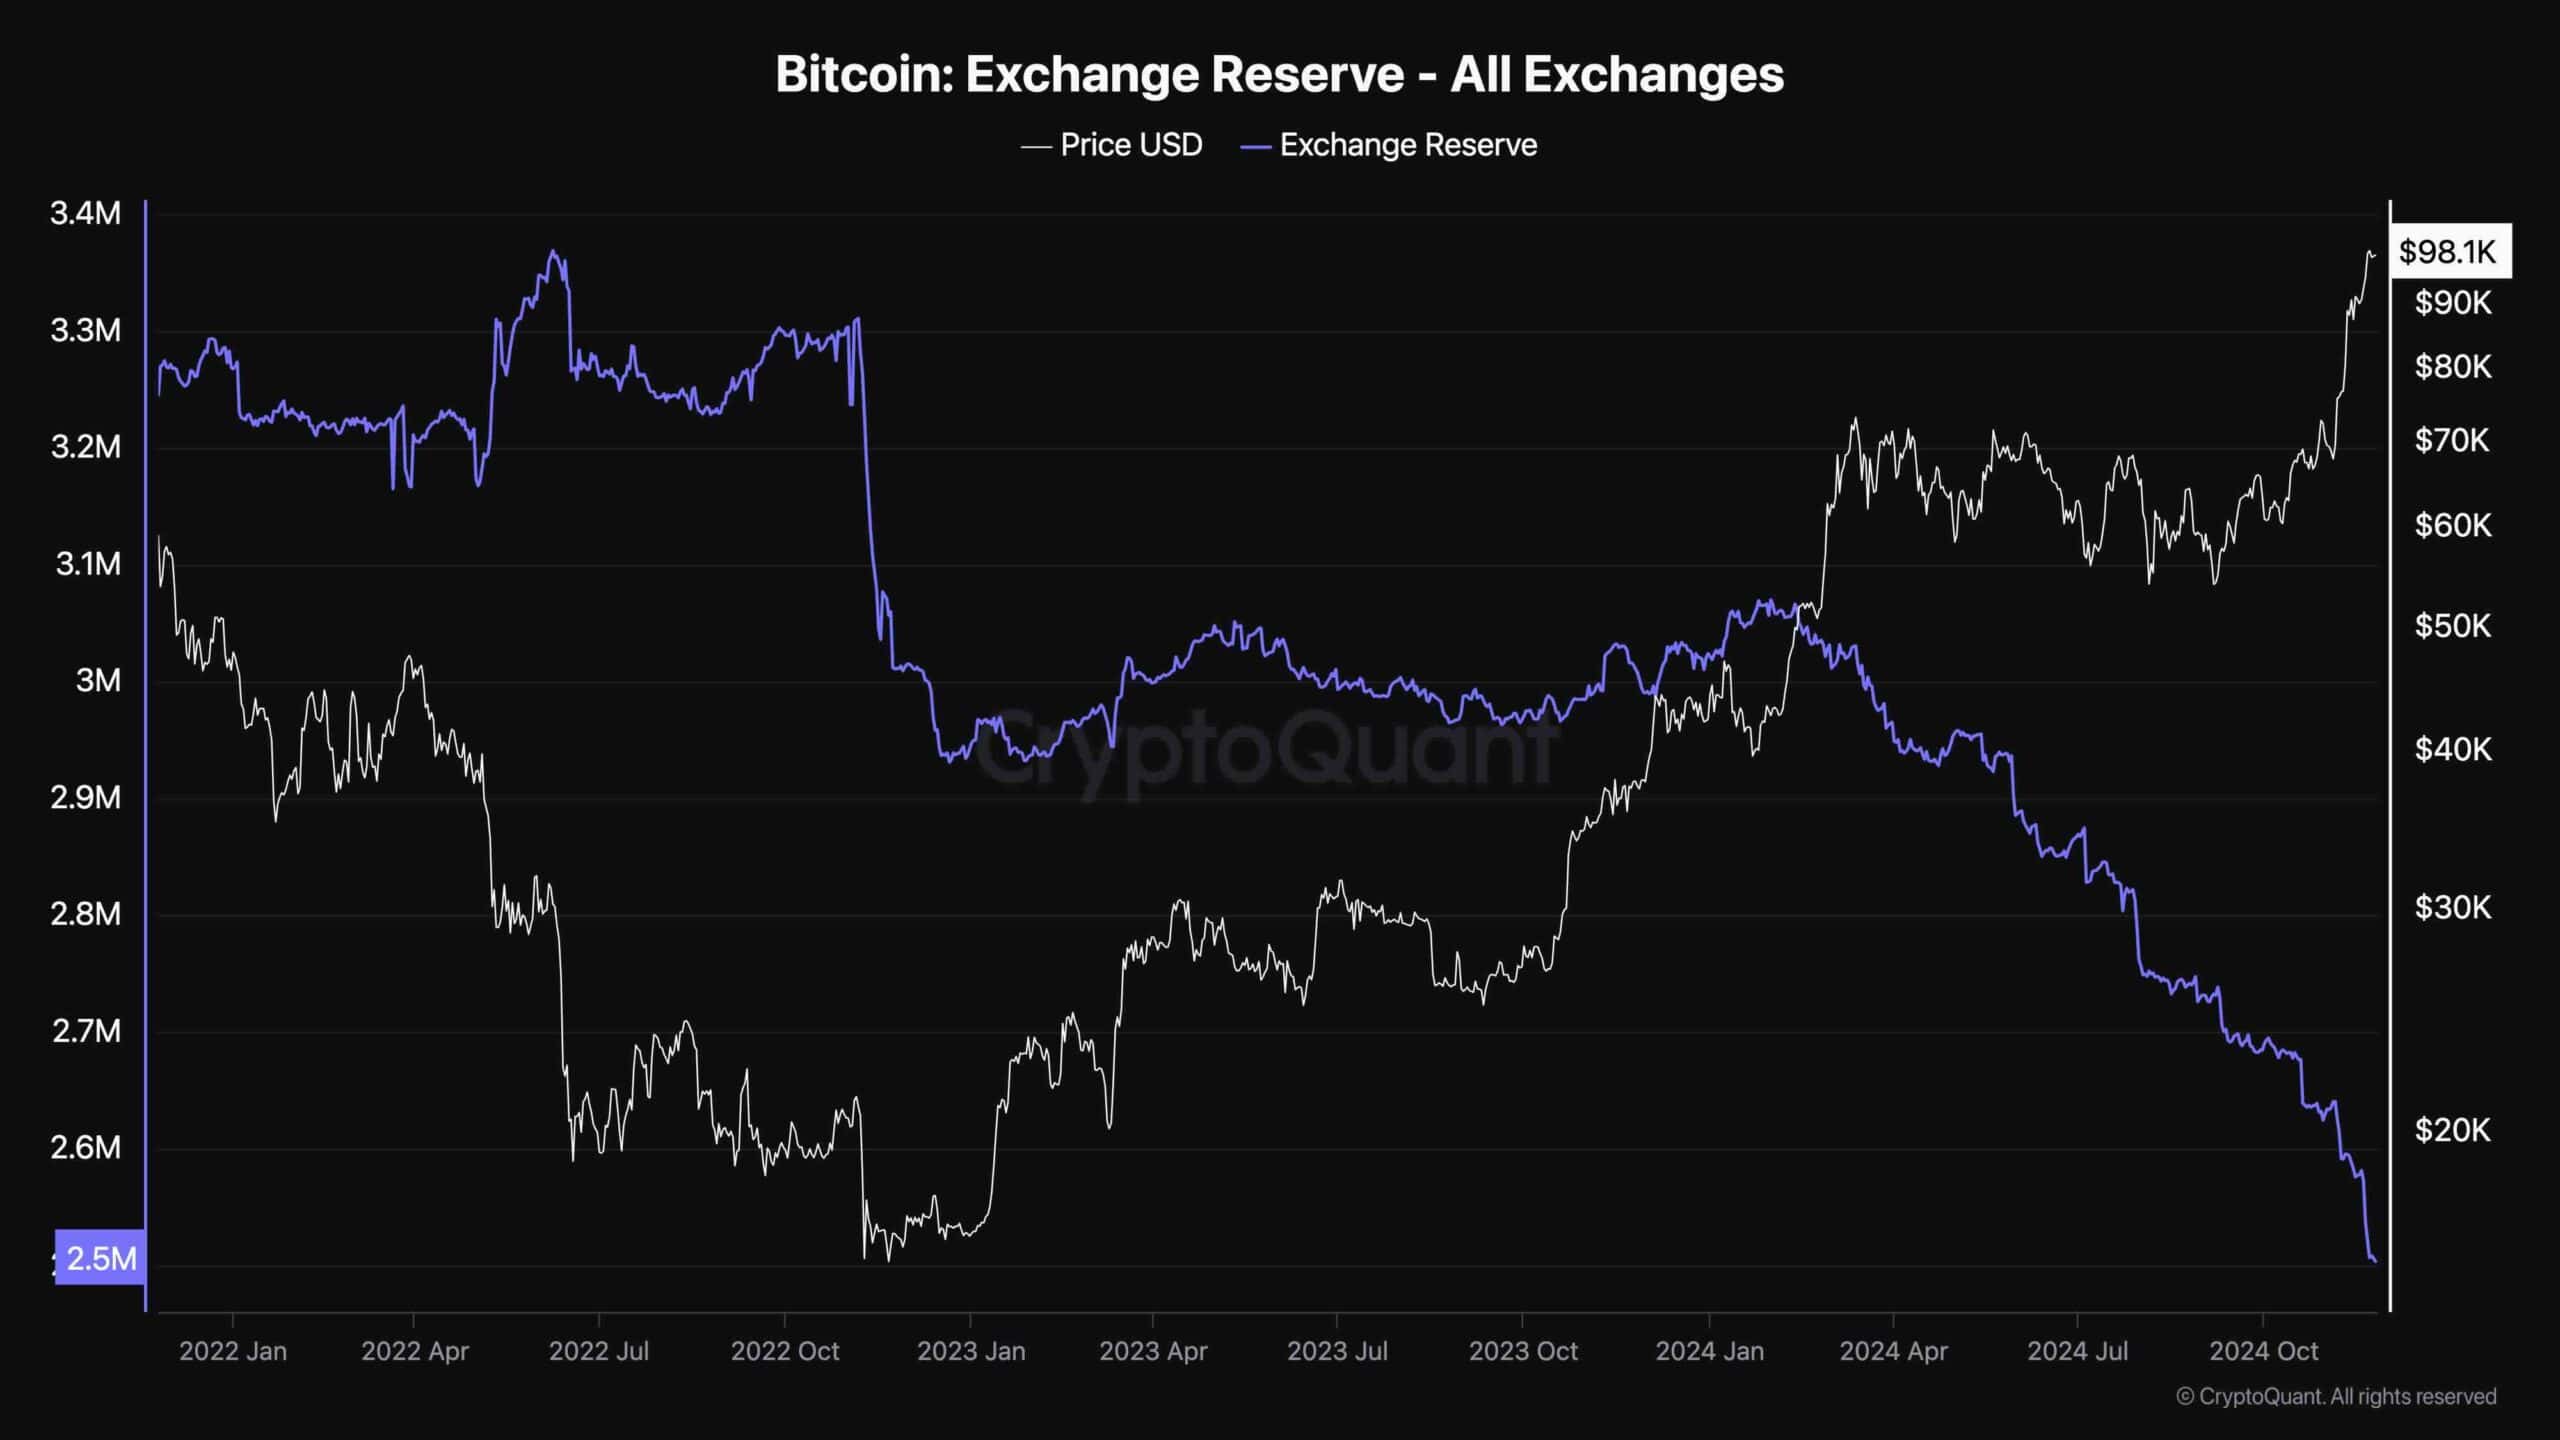
While Bitcoin’s price is continually climbing higher, market participants are extremely optimistic that BTC will finally rise above the $100K mark. These expectations are clearly visible on the exchange reserve chart.
The Bitcoin exchange reserve metric measures the amount of BTC held in wallets associated with trading platforms. These BTC are generally a proxy for supply, as they can be sold at any instant.
As the chart suggests, the exchange reserve metric has been taking a nose dive as investors are withdrawing their Bitcoin from exchanges. This clearly indicates that market sentiment is bullish, and the statement is backed up by a significant supply shock, which could push the price much higher in the coming weeks.
The post Bitcoin Price Analysis: How Deep Will This Correction Be as BTC Slumps by $4K? appeared first on CryptoPotato.


