Bitcoin Price Analysis: How Bearish Is That BTC Rejected From The $60K Once Again?
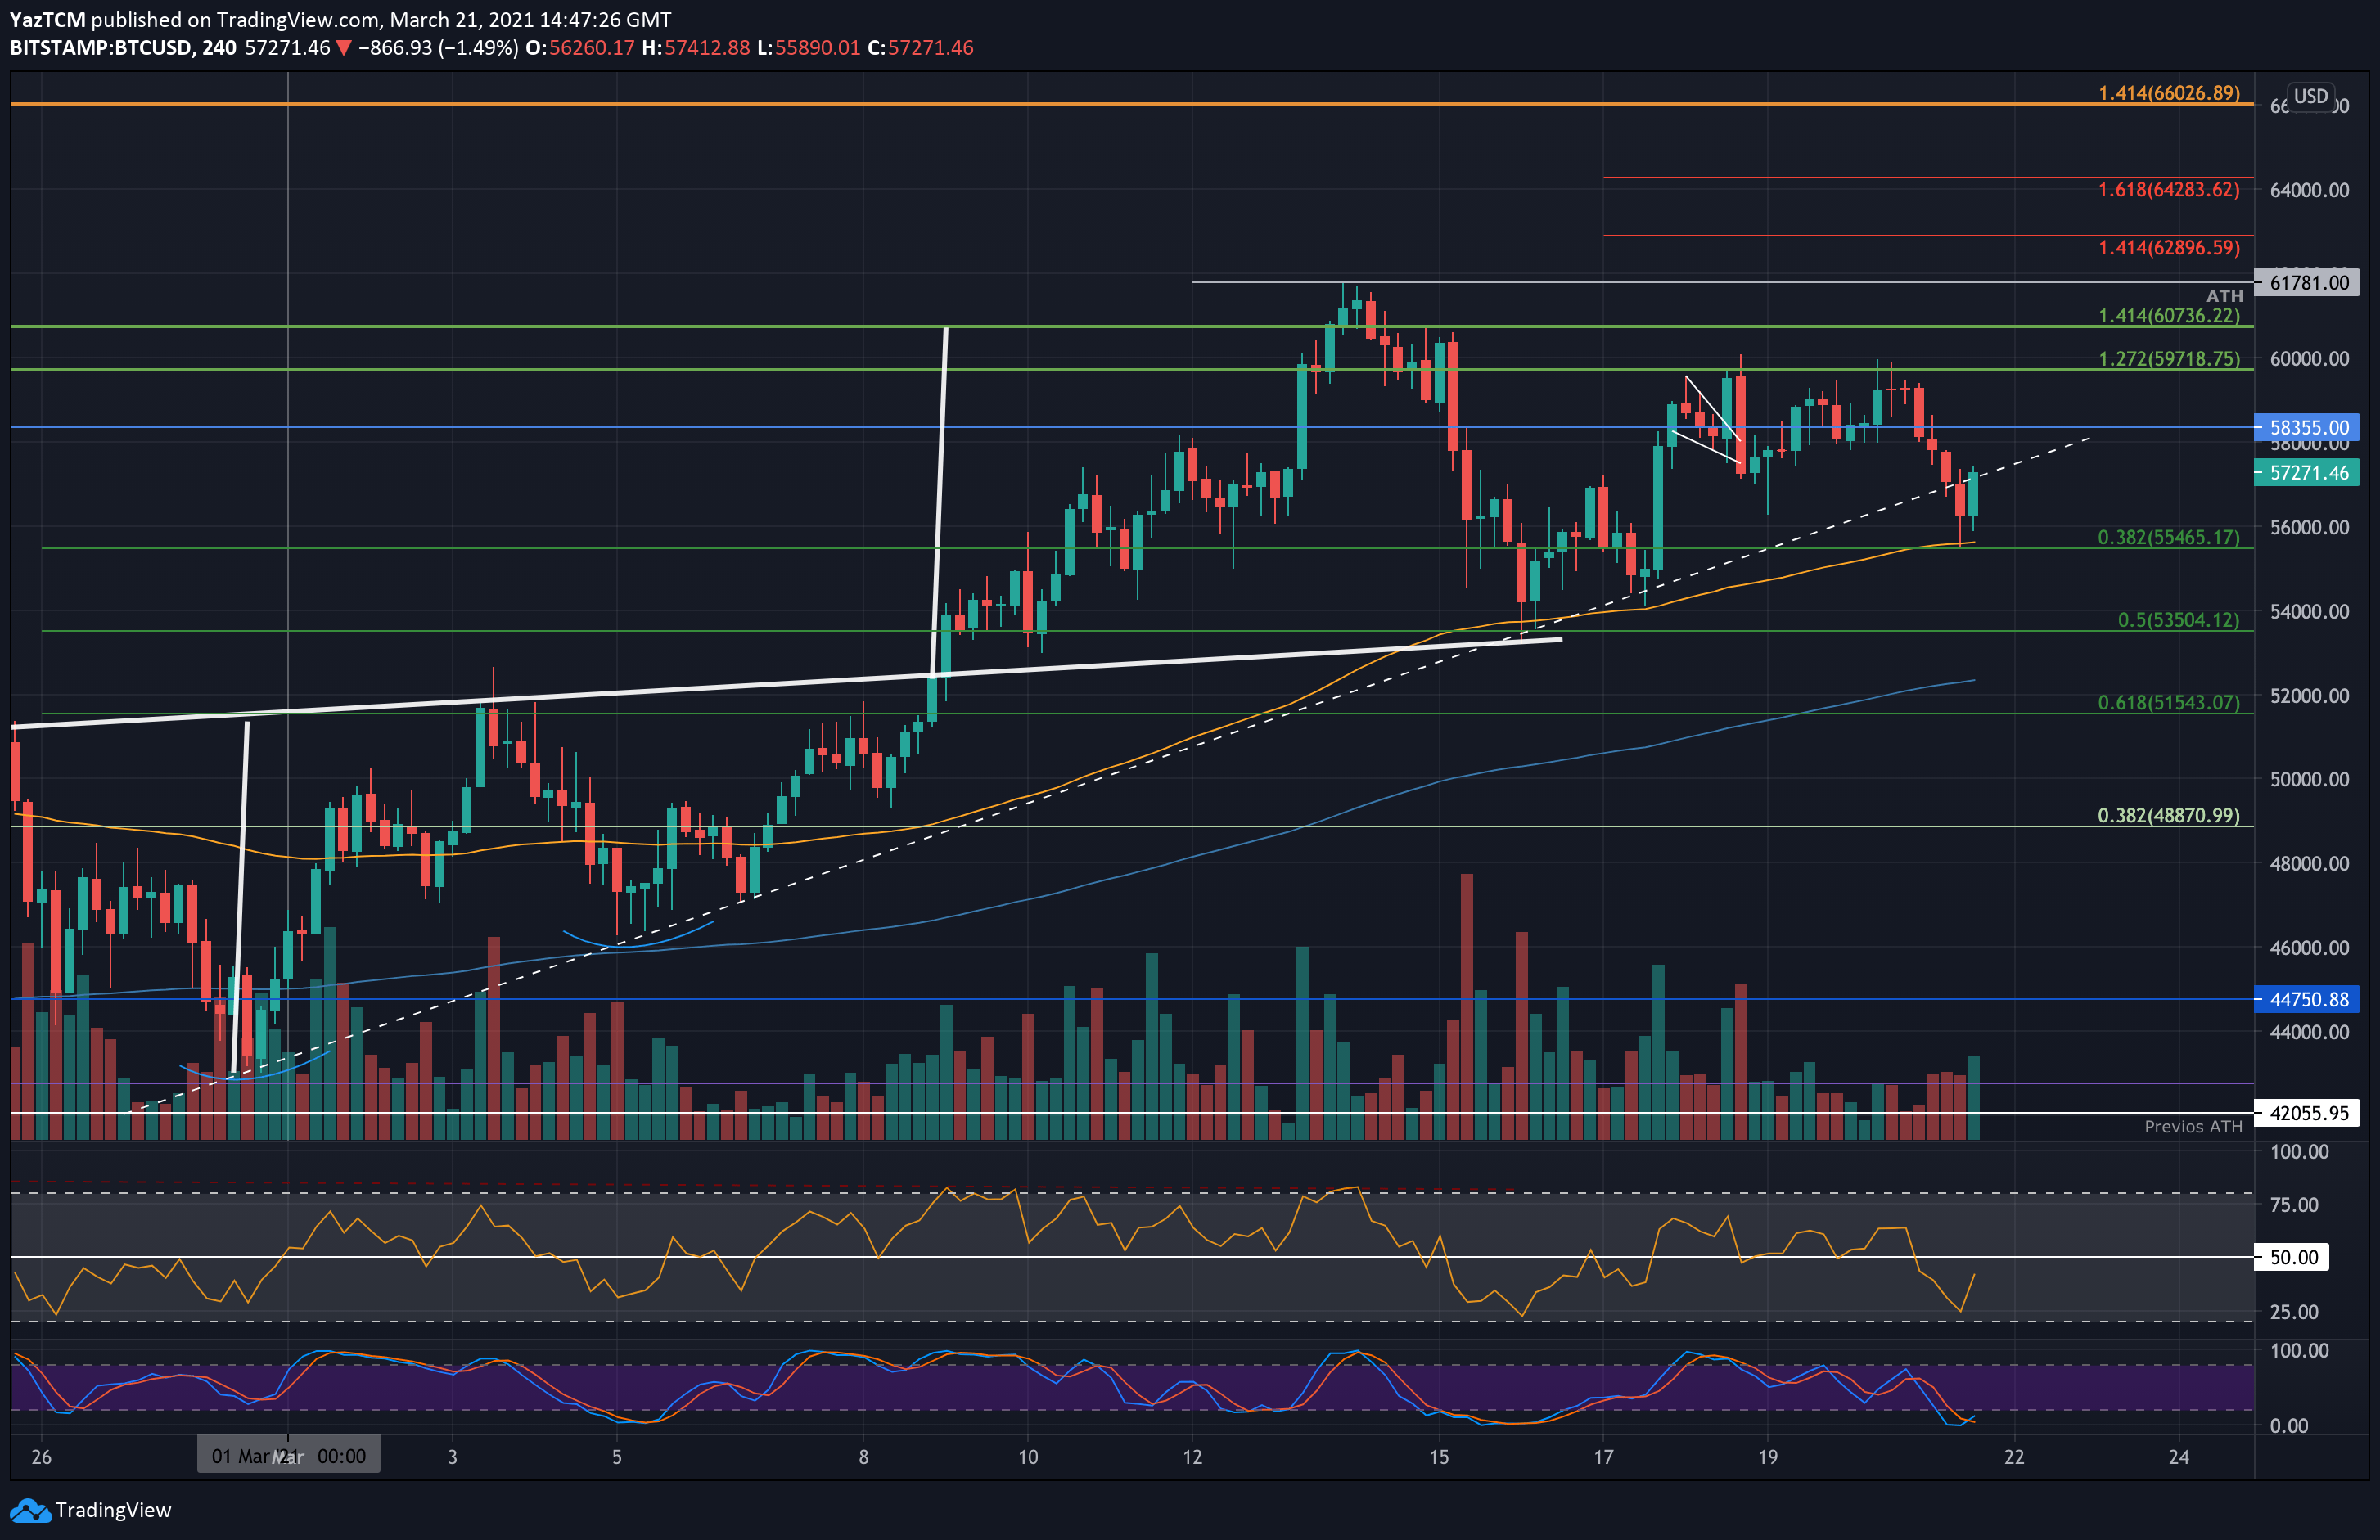
Bitcoin’s price dropped by 3% today, as the cryptocurrency falls to a daily low of $55.5K, which is the 0.382 Fib level. After the quick drop, BTC was able to bounce nicely.
Just yesterday, Bitcoin had seen another failed attempt to break the $60k milestone, which brings it to a total of three failed attempts to break the level over the past 3 days.
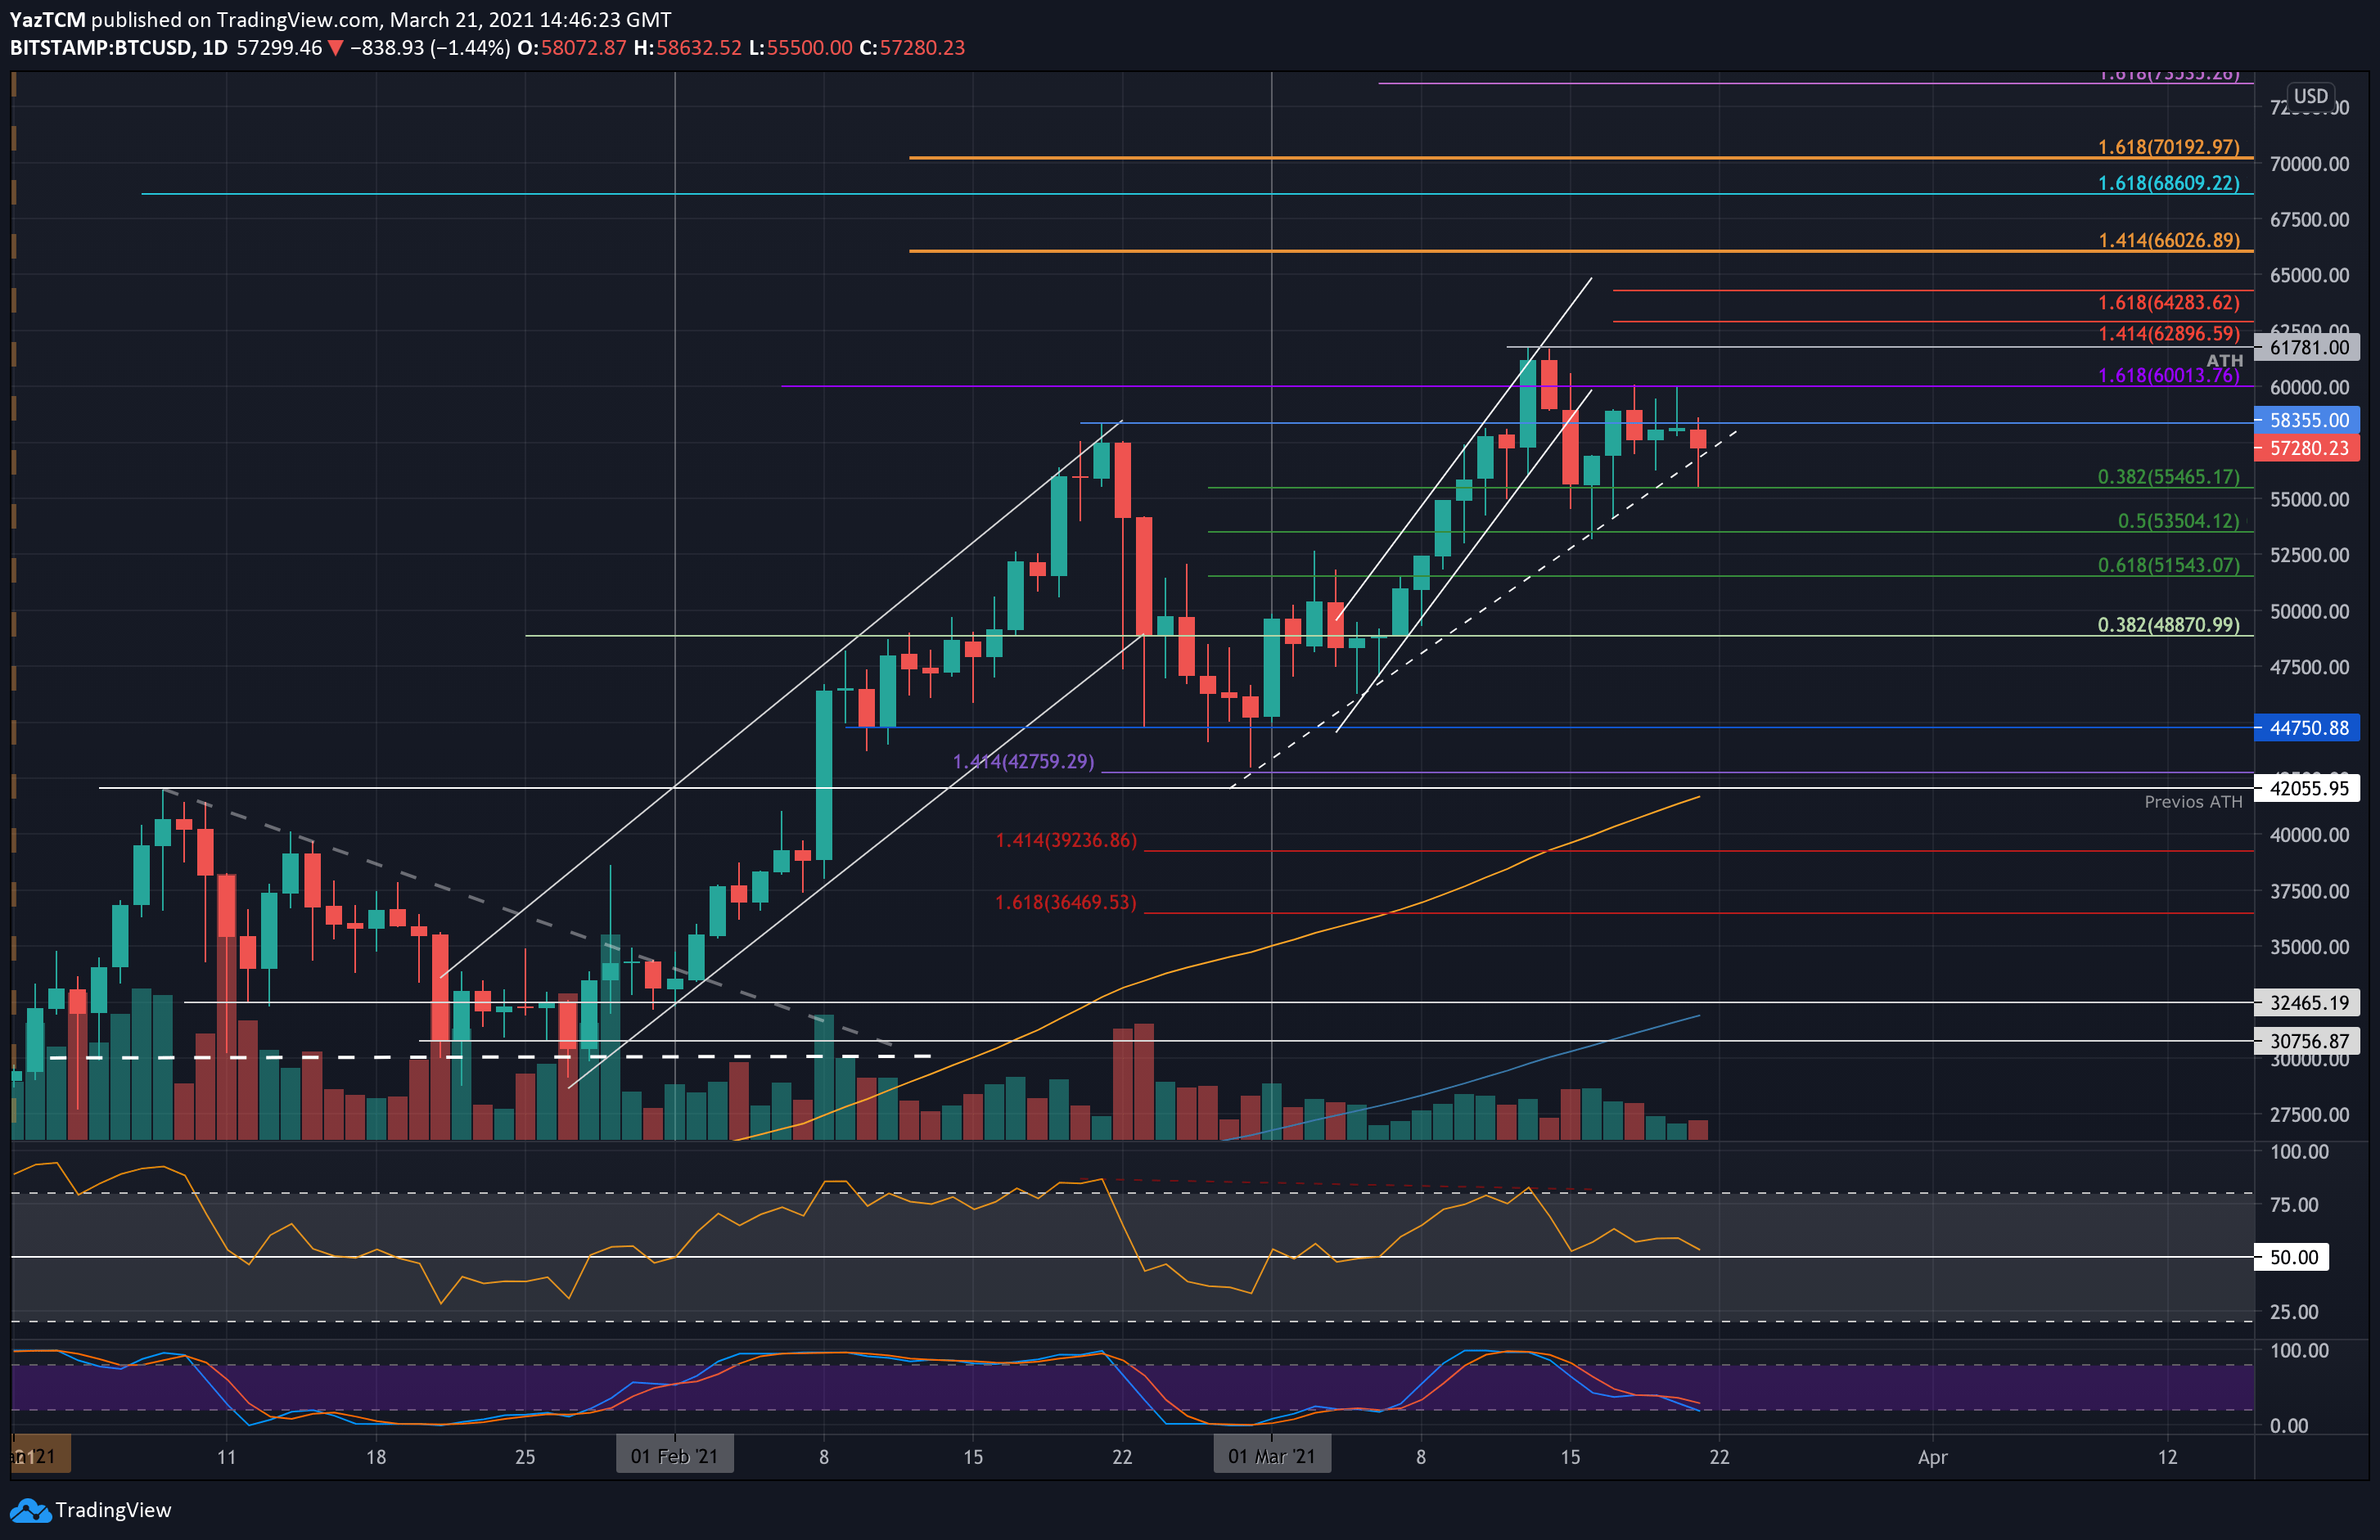
Despite the decrease, the primary cryptocurrency is still trading above a short-term ascending trend line that has been in play since the beginning of March.
Today, the rebound from $55,465 has allowed Bitcoin to establish a range between $60,000 and $55K, with a strong S/R level of around $57.5K. The coin would now need to break one of the boundaries of this range to dictate the market’s next direction.
There are two bullish signs – first, Bitcoin didn’t break the higher-lows positive trajectory on the hourly chart. Second, today’s drop was followed by a minimal amount of trading volume. On the other hand, the fact that the $60k saw another third failed attempt and a quick rejection after it, might signal a red flag for the bulls.
BTC Price Support and Resistance Levels to Watch
Key Support Levels: $55,465, $53,500, $52,500, $51,540, $50,000.
Key Resistance Levels: $58,355, $60,000, $61,780, $62,900, $62,280.
Looking ahead, the first level of support lies at the short term ascending trend line.This is followed by $55,465 (.382 Fib, today’s low), $53,500 (.5 Fib), $52,500, and $51,540 (.618 Fib). Added support is then expected at $50,000 and $48,870 (.382 Fib).
On the other side, the first level of resistance lies at current level of $57.5K, followed by $58,355 (February highs). This is followed by $60,000, $61,780 (ATH Price), $62,900 (1.414 Fib Extension), $65,280 (1.618 Fib extension), and $65,000.
The Daily RSI is now reapproaching the midline, indicating that the bullish momentum is fading and indecision looms within the market. The current trading range characterizes this indecision, and a break beneath the 50 level on the RSI is likely to lead to Bitcoin falling beneath the current range.
Bitstamp BTC/USD Daily Chart
Bitstamp BTC/USD 4-Hour Chart