Bitcoin Price Analysis: Here’s What it Will Take for BTC to Break Above $65K
Bitcoin’s price has recently recovered from a month of bearish price action. Considering the current upward momentum, the market might even make a new all-time high soon.
Technical Analysis
By TradingRage
The Daily Chart
On the daily chart, the price has found support at the $56K support level. The 200-day moving average, located around the $60K area, has also been reclaimed, along with the $60K level itself.
Yet, the market is struggling to break above the $65K resistance level, as it has failed in the last three days. Meanwhile, with the RSI showing a clear bullish momentum, it could only be a matter of time before BTC trades above the $70K mark again. This scenario would fail if the price drops below $60K again.

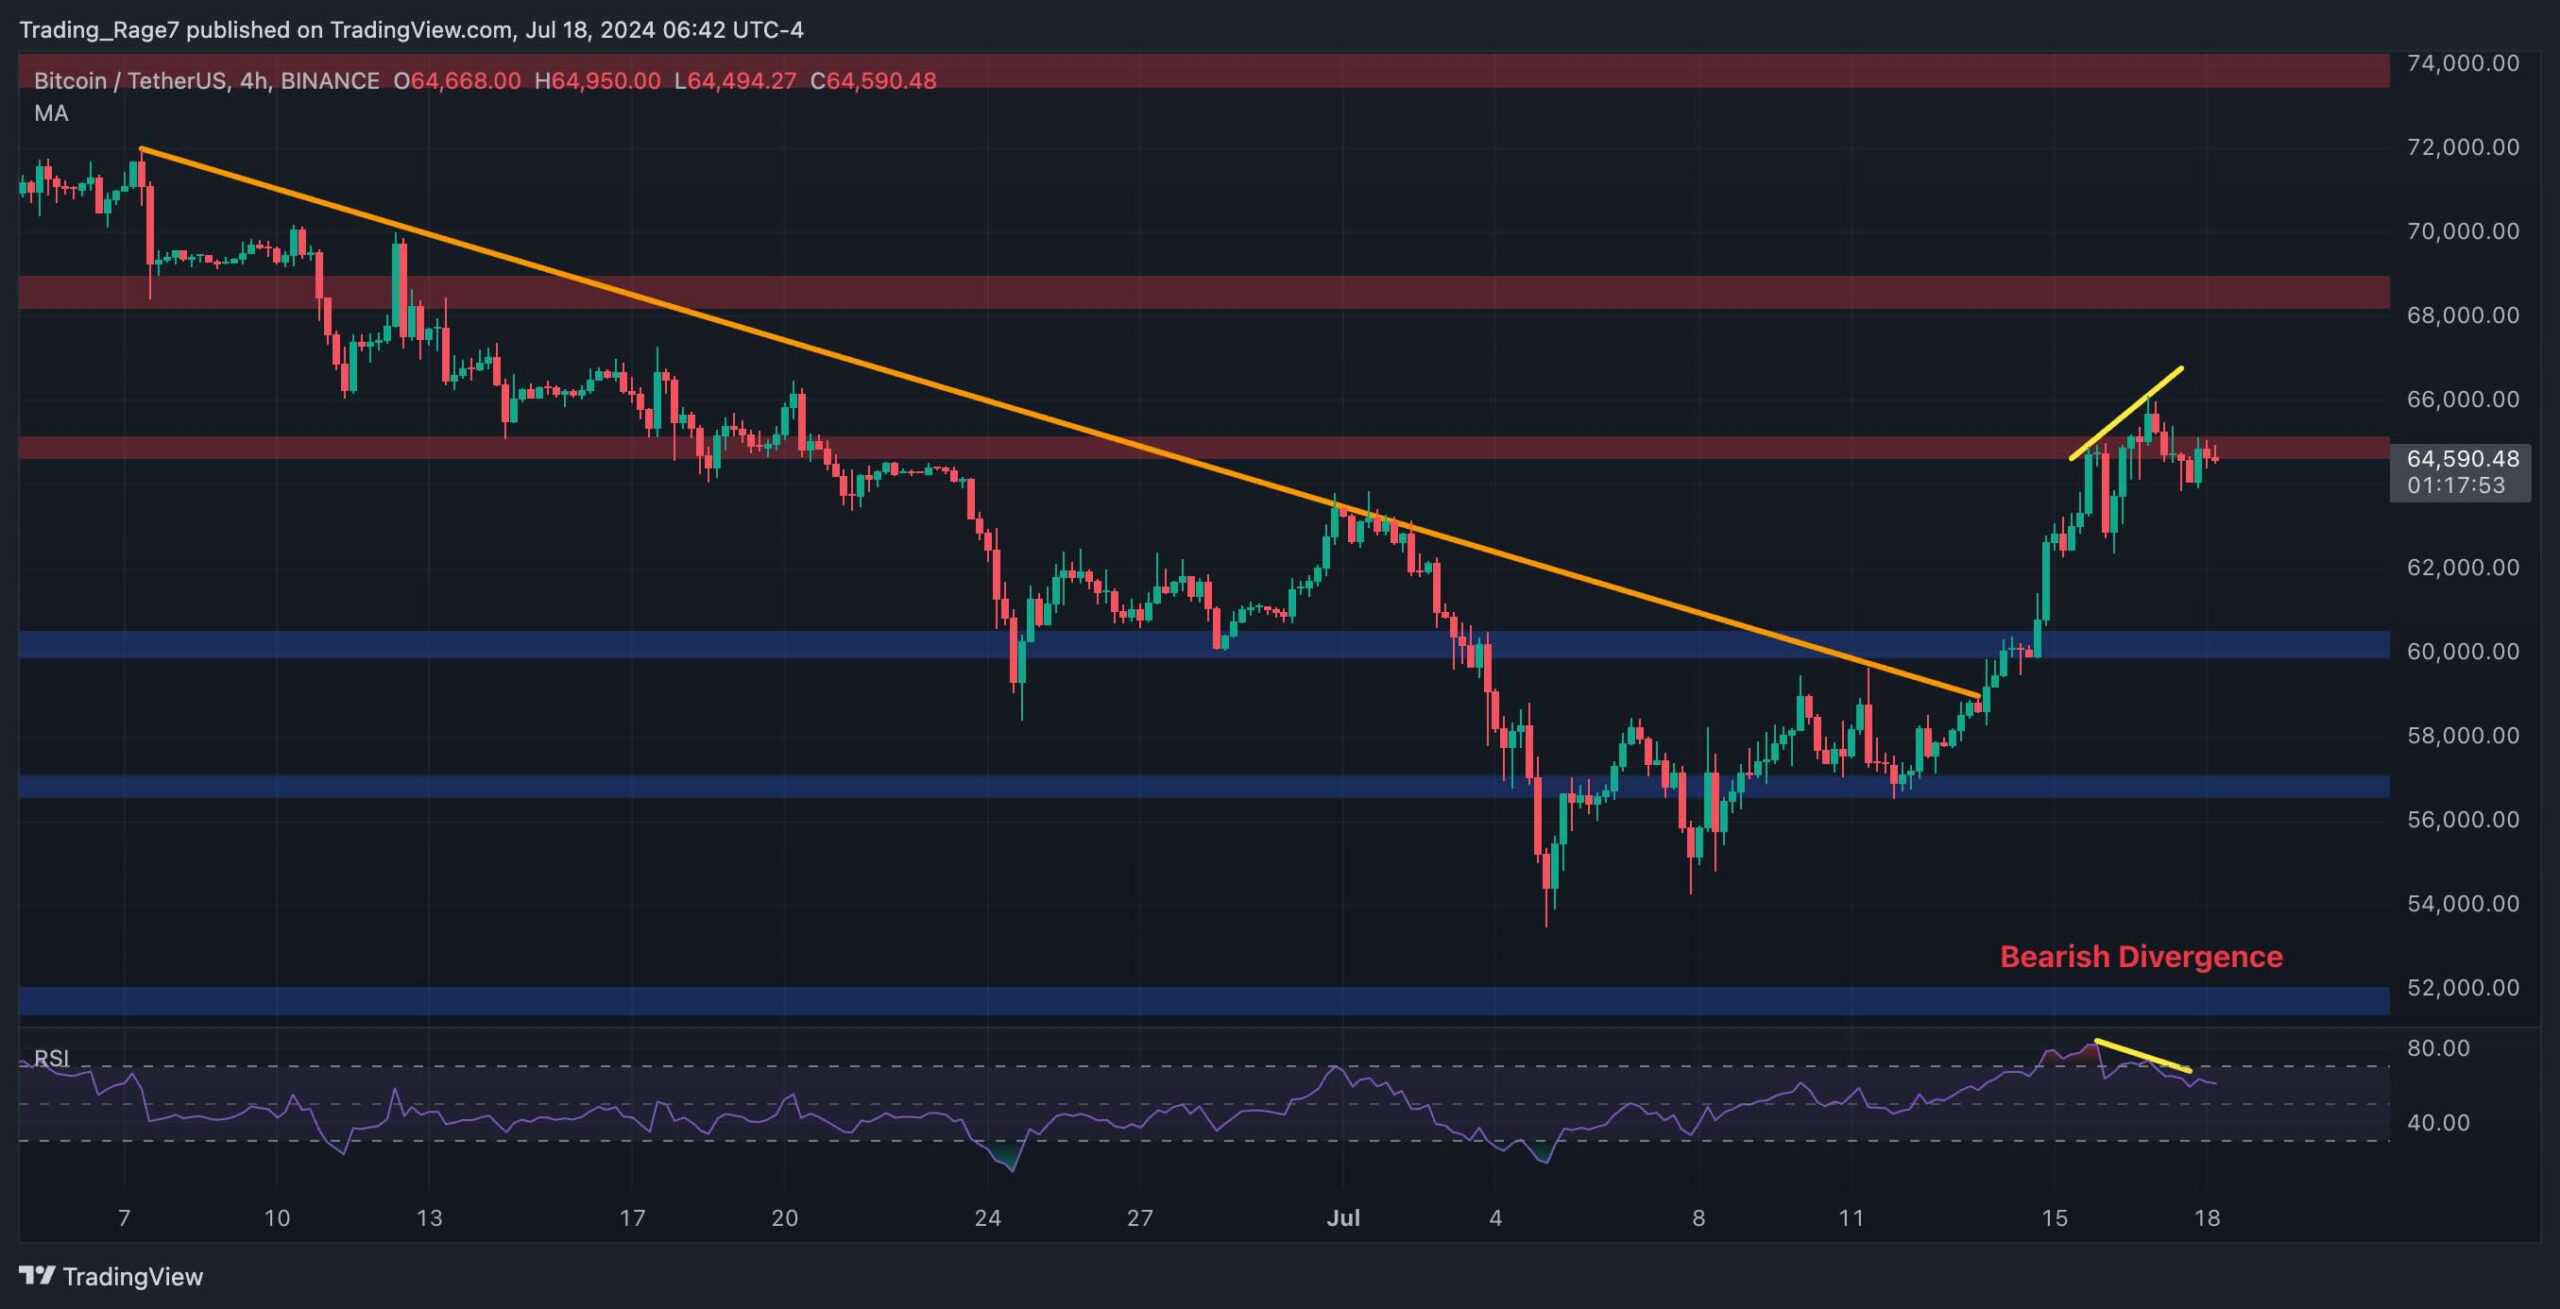
The 4-Hour Chart
Looking at the 4-hour timeframe, the market has begun an impulsive rally since breaking the bearish trendline to the upside. Yet, the attempts so far have been unsuccessful in getting past the $65K level, and a correction cannot be ruled out.
Moreover, the Relative Strength Index also shows a clear bearish divergence and overbought signal, which could induce a decline toward the $60K level. Yet, the overall market structure is still bullish in the short term.
On-Chain Analysis
By TradingRage
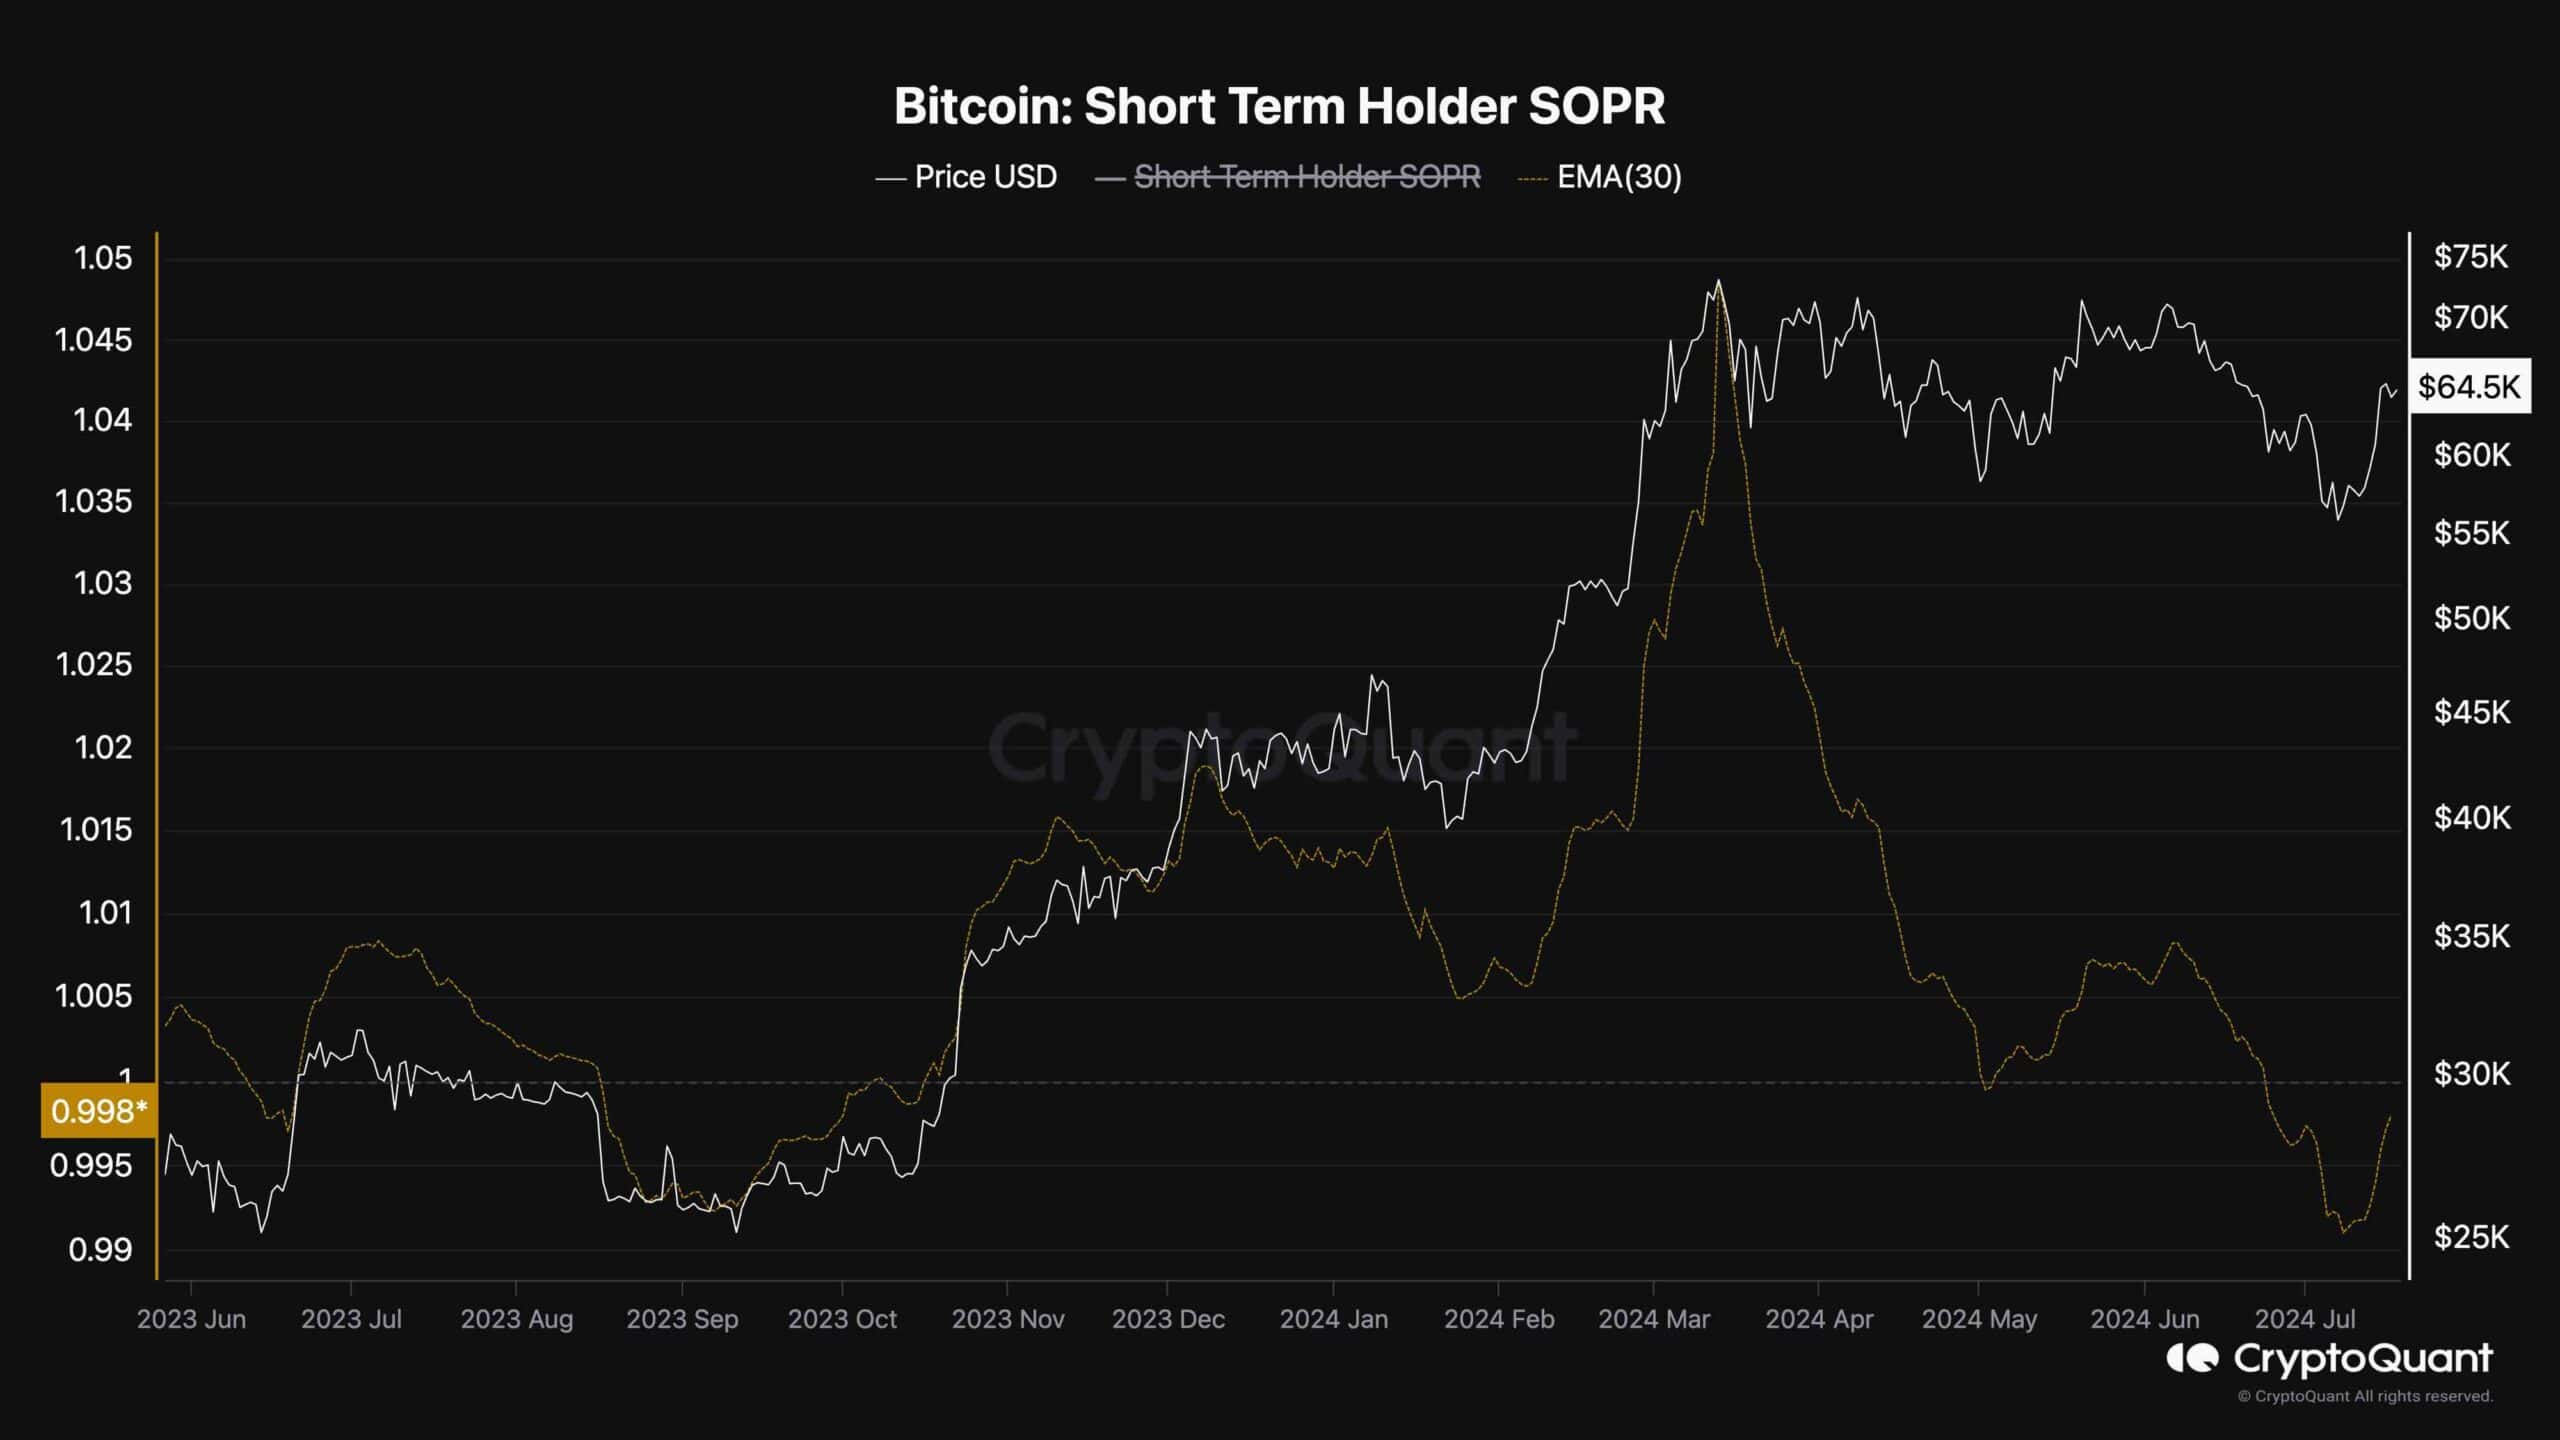
Bitcoin Short-Term Holder SOPR
The buying and selling behavior of short-term BTC holders is one of the key factors that shape the price action in the near term. Therefore, analyzing the Bitcoin Short-Term Holder SOPR metric can be beneficial in predicting price action in the upcoming weeks.
The Short-Term Holder SOPR metric, demonstrated in the chart above, determines whether the holders holding their coins for less than 6 months are realizing profits or losses. Values above 1 indicate selling at a profit, while values below 1 show loss realization.
As the chart displays, the 30-day exponential moving average of the STH SOPR has been below 1 lately, indicating that the short-term holders are selling their coins at a loss. This is a typical signal for correction bottoms during a long-term bull market. So, if the metric recovers above 1, the price will likely rally higher and create a new record high in the coming weeks.
The post Bitcoin Price Analysis: Here’s What it Will Take for BTC to Break Above $65K appeared first on CryptoPotato.