Bitcoin Price Analysis: Following the Latest Drop, Was $69K the Cycle’s Top?
Options Market Analysis
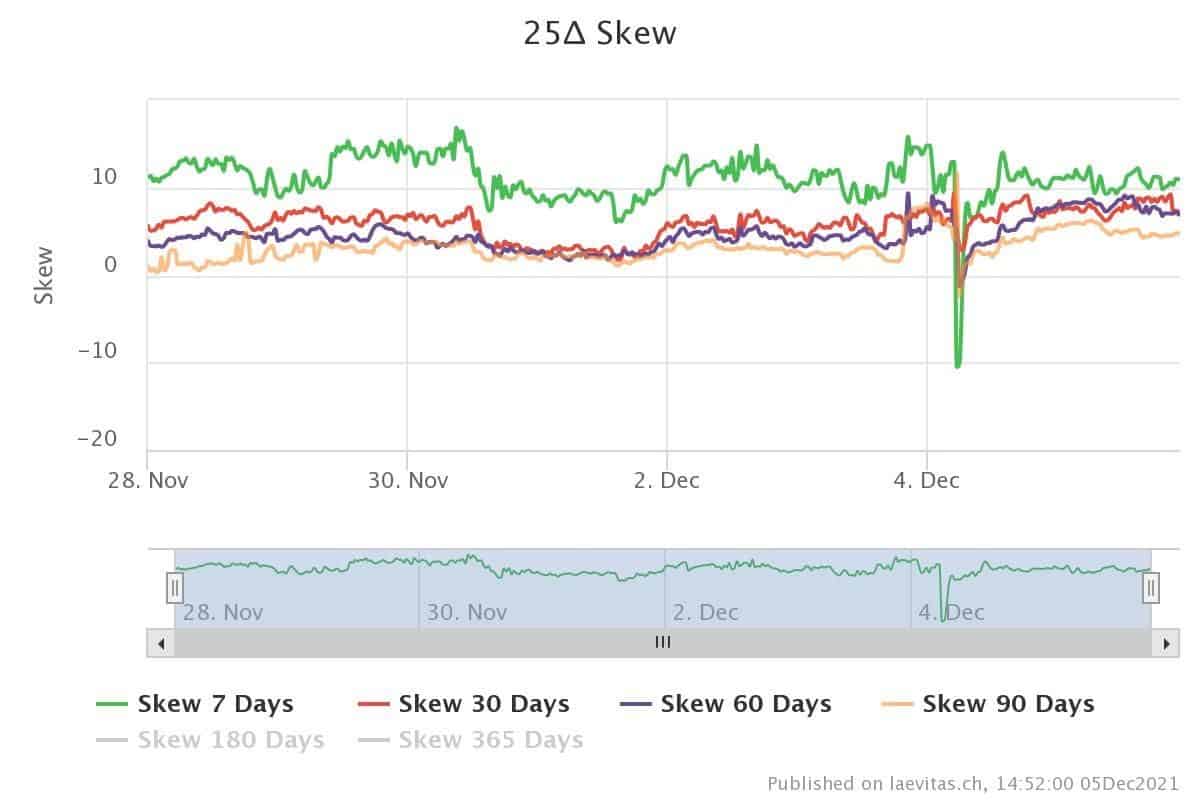
25 Delta Skew and Volatility Analysis
On December 4th, the bitcoin price dropped about $16k. Options traders have set different hedging strategies like buying lots of puts at $50k & $52k strike prices during the last weeks for the possible downside.
To find out what happened in the options market, It’s better to look at 25 delta Skew. This is a way of measuring the volatility skew. For example, for one month, it can be computed using the following formula: skew 1M = (IV 25 Delta put 1M – IV 25 Delta call 1M)/ATM IV 1M. The following chart shows that demand for calls increased despite the bitcoin downside on December 4th.
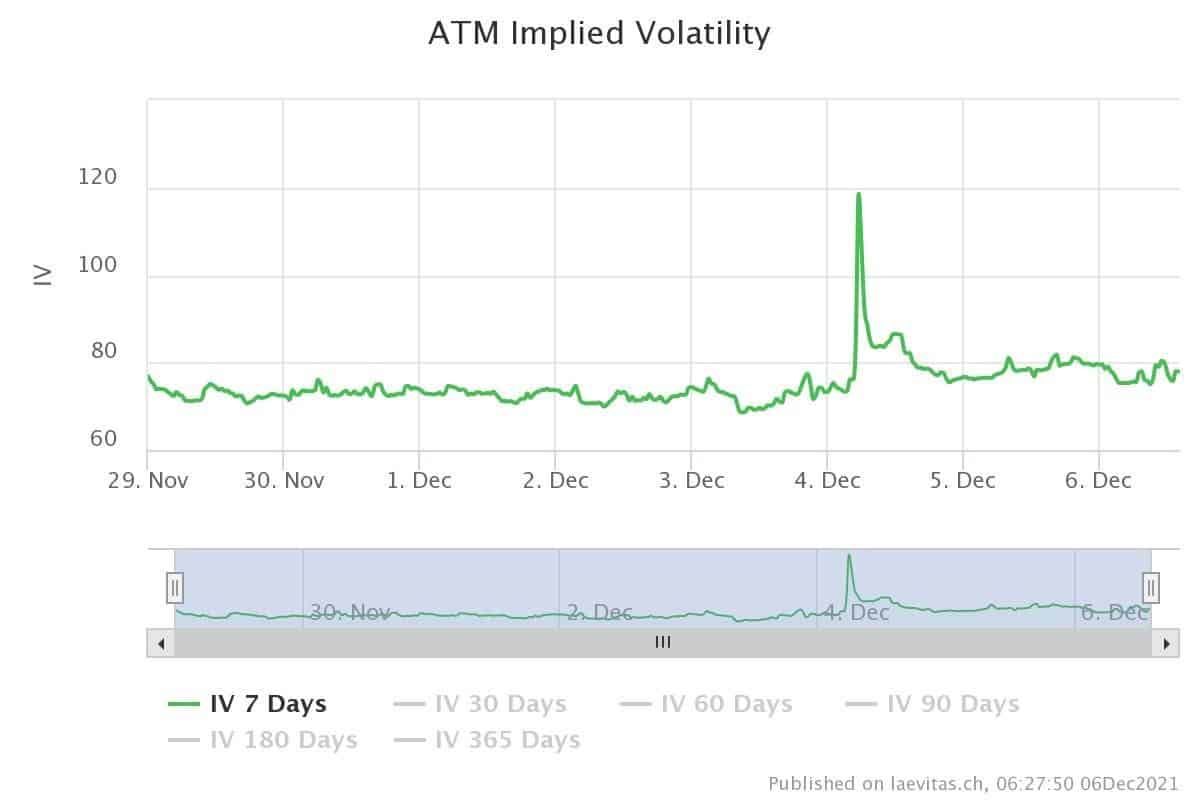
One Week Implied Volatility (IV) Spiked During the Sell-Off
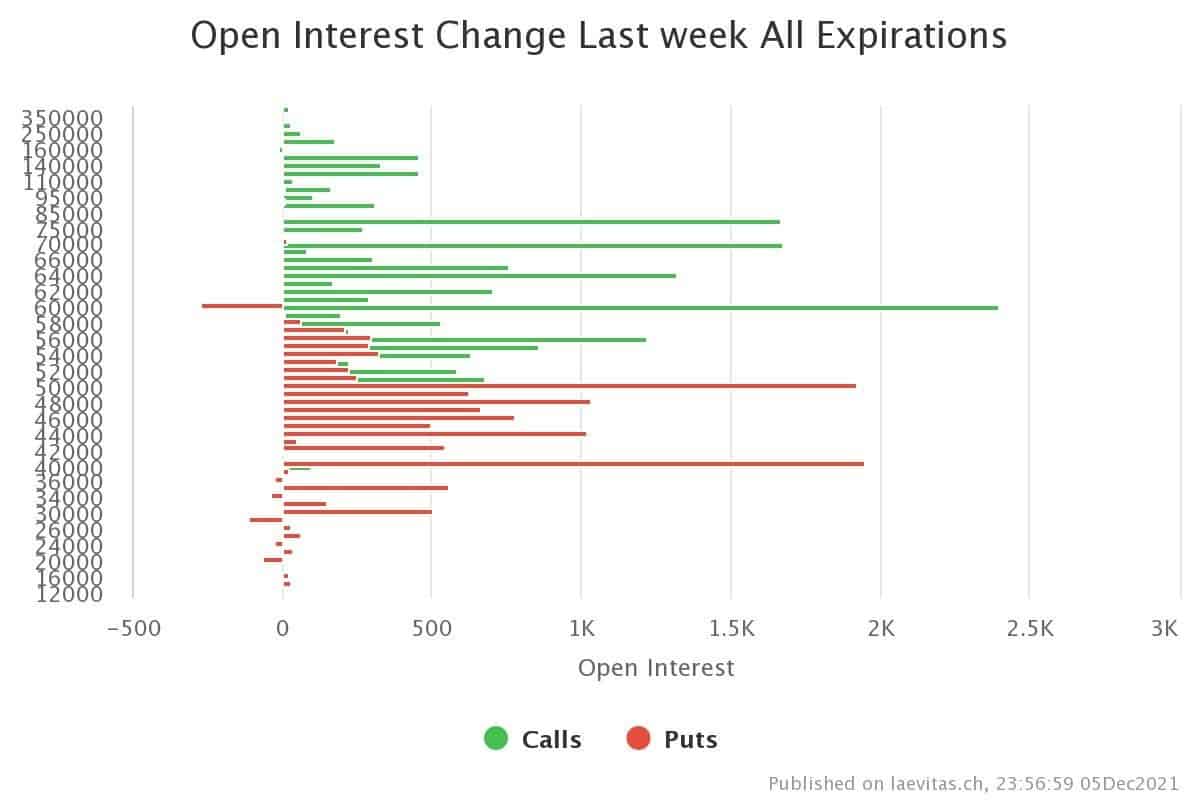
Since last week, we can see more call activities. There is demand for calls at $60k strike for expiry in December and calls for $70k & $80k strikes for expires in January and March. It seems that options traders do not think this ATH was the cycle top.
Technical Analysis
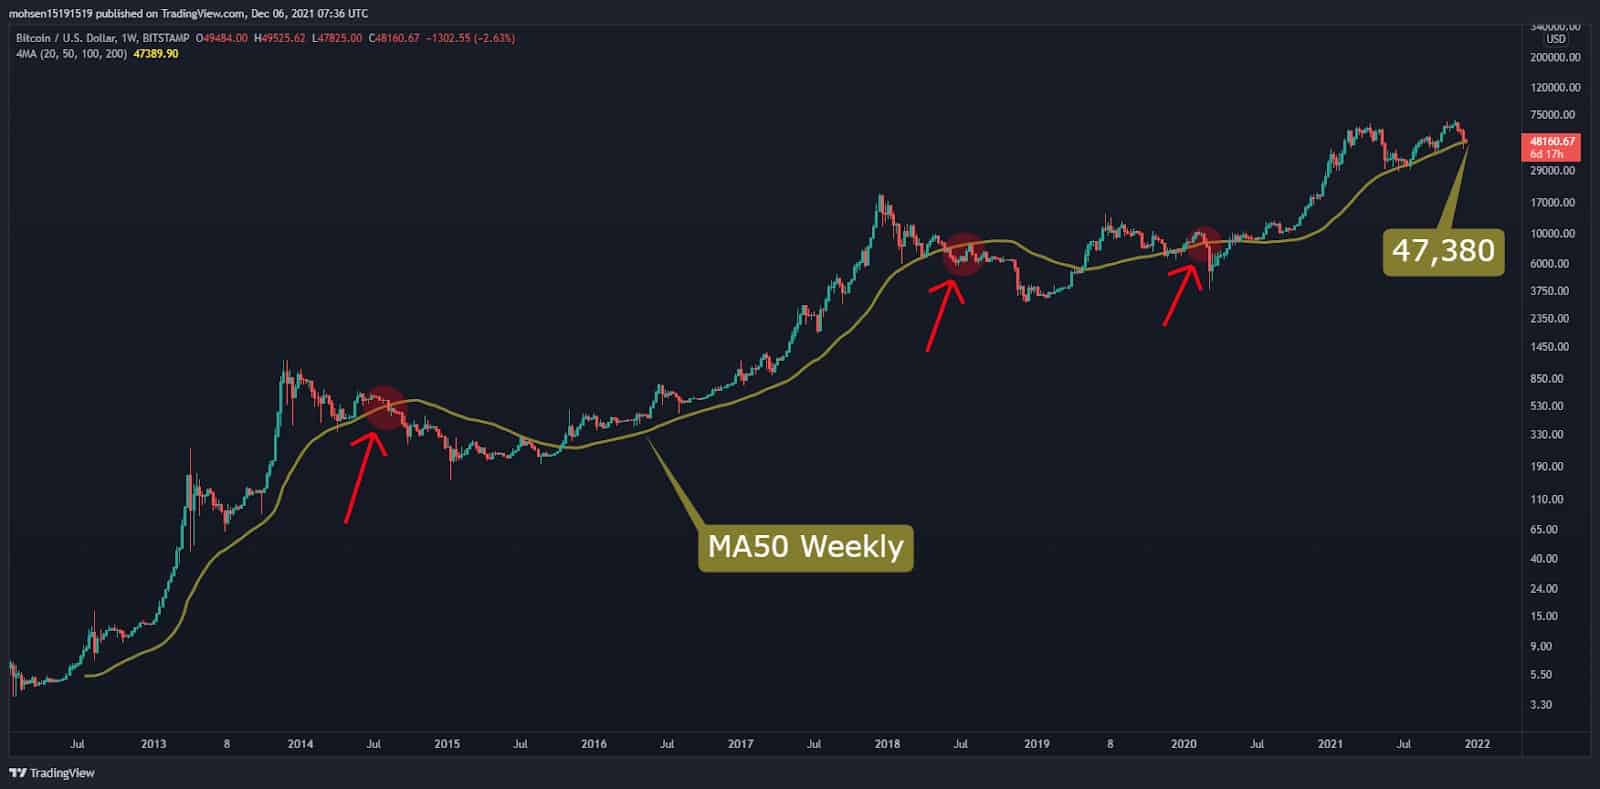
Long-Term Analysis
Looking at the historical trends of bitcoin on the weekly time frame, we see that it has moved above MA50 in each bull run and has dropped 60-79% whenever this Moving Average has crossed.
The MA50 is currently at $47.3K, and bulls are trying to protect that. Also, the Static support at 42k looks intense, and it is expected that bitcoin will rebound quickly if we see a temporary cross below this level.
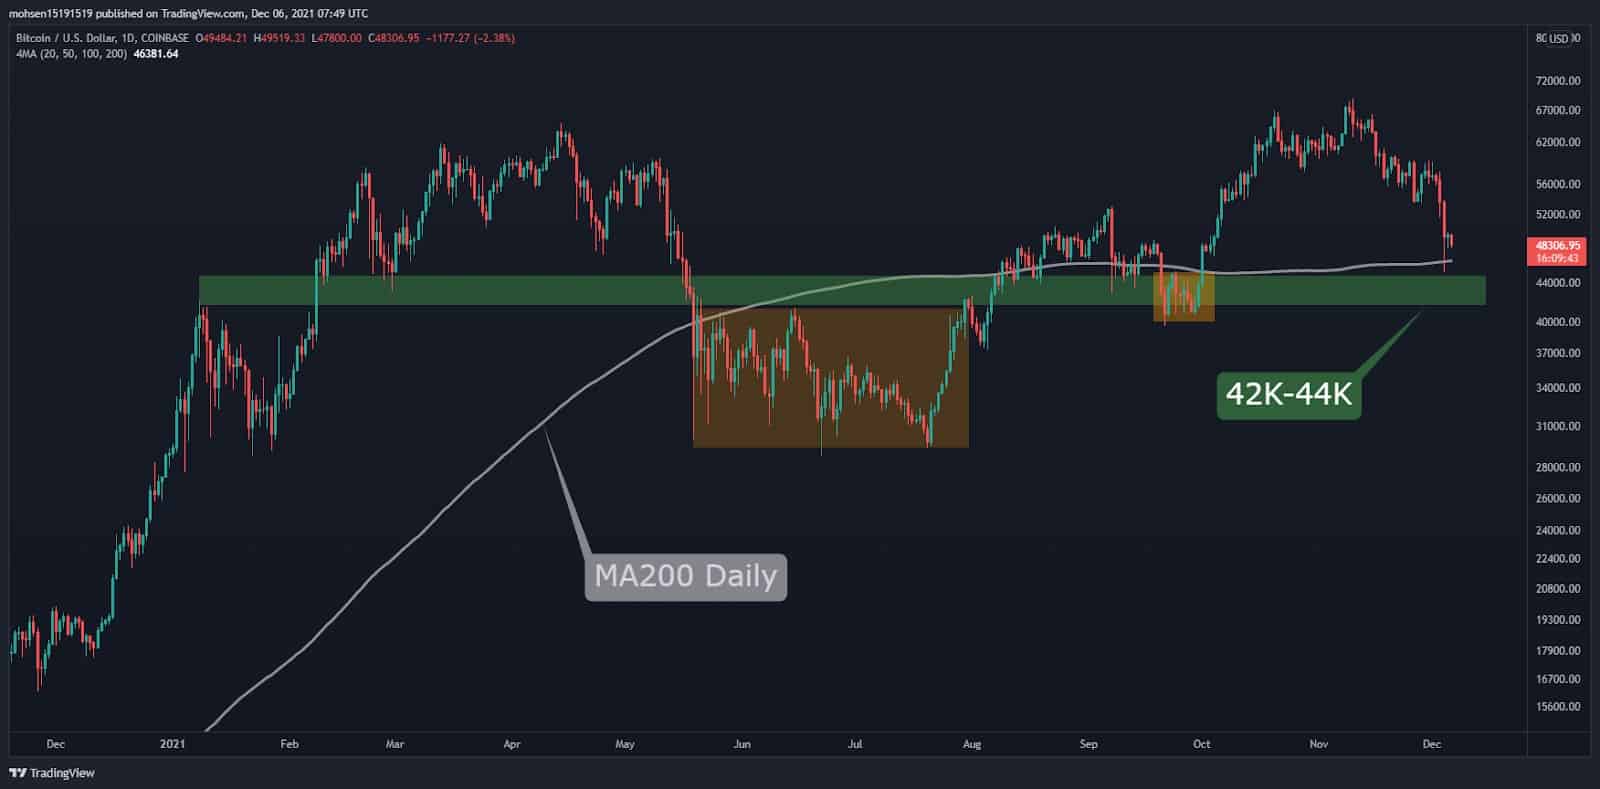
Mid-Term Analysis
On a daily timeframe, BTC is touching the strong daily support of MA200, which intersects with the static support level (green), and bitcoin is also making a higher low in this timeframe.
Historically, losing the MA200 has led to a ranging phase that consumes the required momentum to continue the uptrend. The level of $42K-$44K seems to be strong support for BTC, but a failure of these levels would show the power of the bears.
The support to look out for is at $44K, $42K, and $37K, whereas resistance lies at $50K and $53K.
On-Chain Analysis
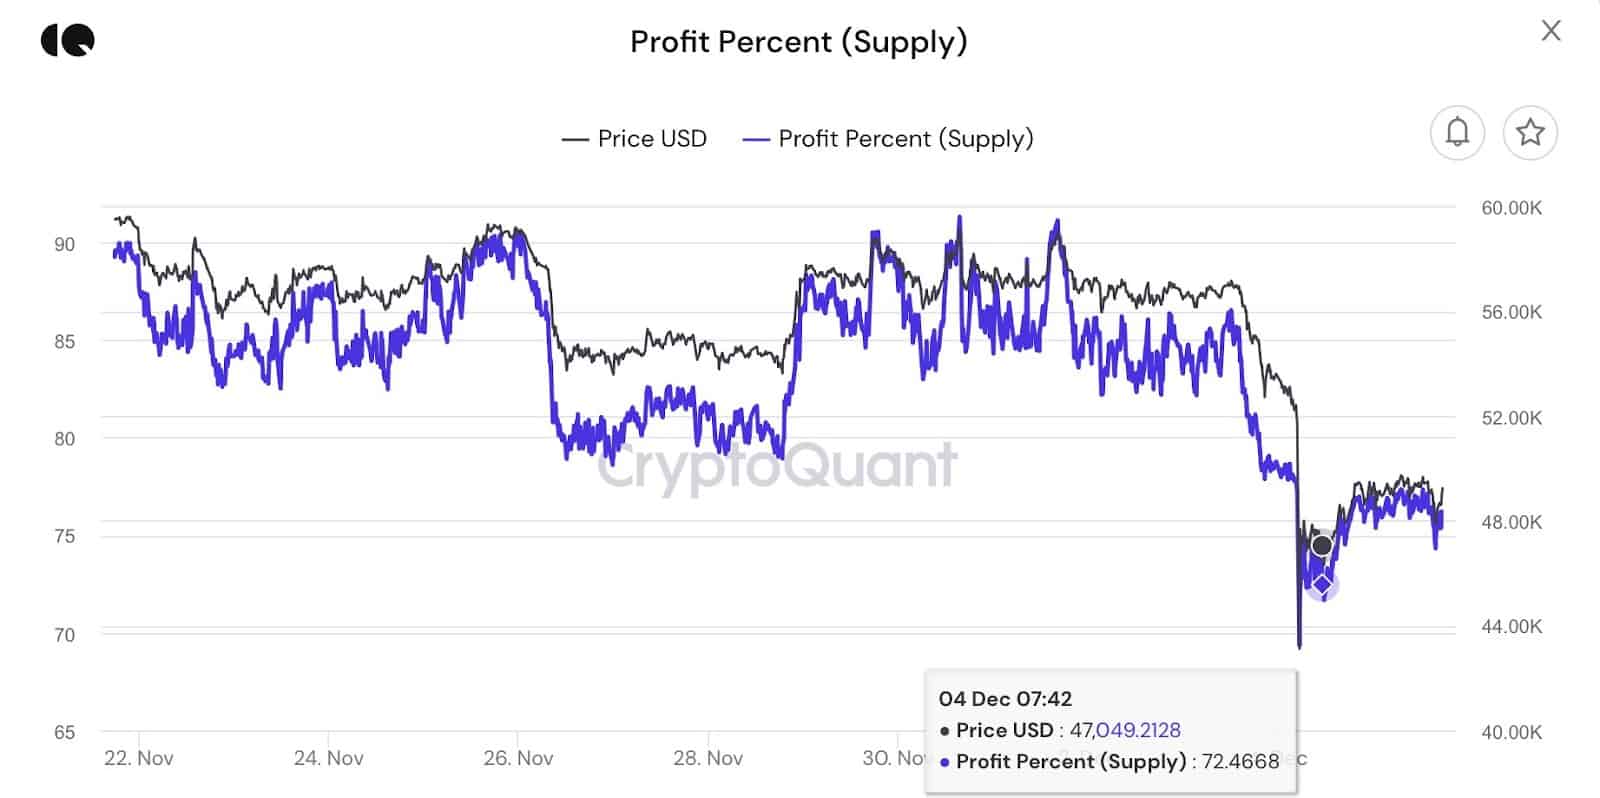
The top-buyers appear to be under pressure.
Almost 28% of the supply was moved above $47K. These players are (most likely) going through an exhausting ranging period in December. They are the leading sellers, and historically, they tend to sell at a loss if this exhausting phase lasts for an extended period.
The above analysis was complied by @N__E__D__A, @GrizzlyBTClover, and @CryptoVizArt. Data provided by @tsypruyan exclusively for CryptoPotato.