Bitcoin Price Analysis: Following $300 Daily Gains, Can The Bullish Momentum Drive BTC Beyond $9,000?
A quick update following yesterday’s analysis. As we mentioned here yesterday on the previous analysis – Bitcoin price’s recent correction down to $8200 was healthy (so far).
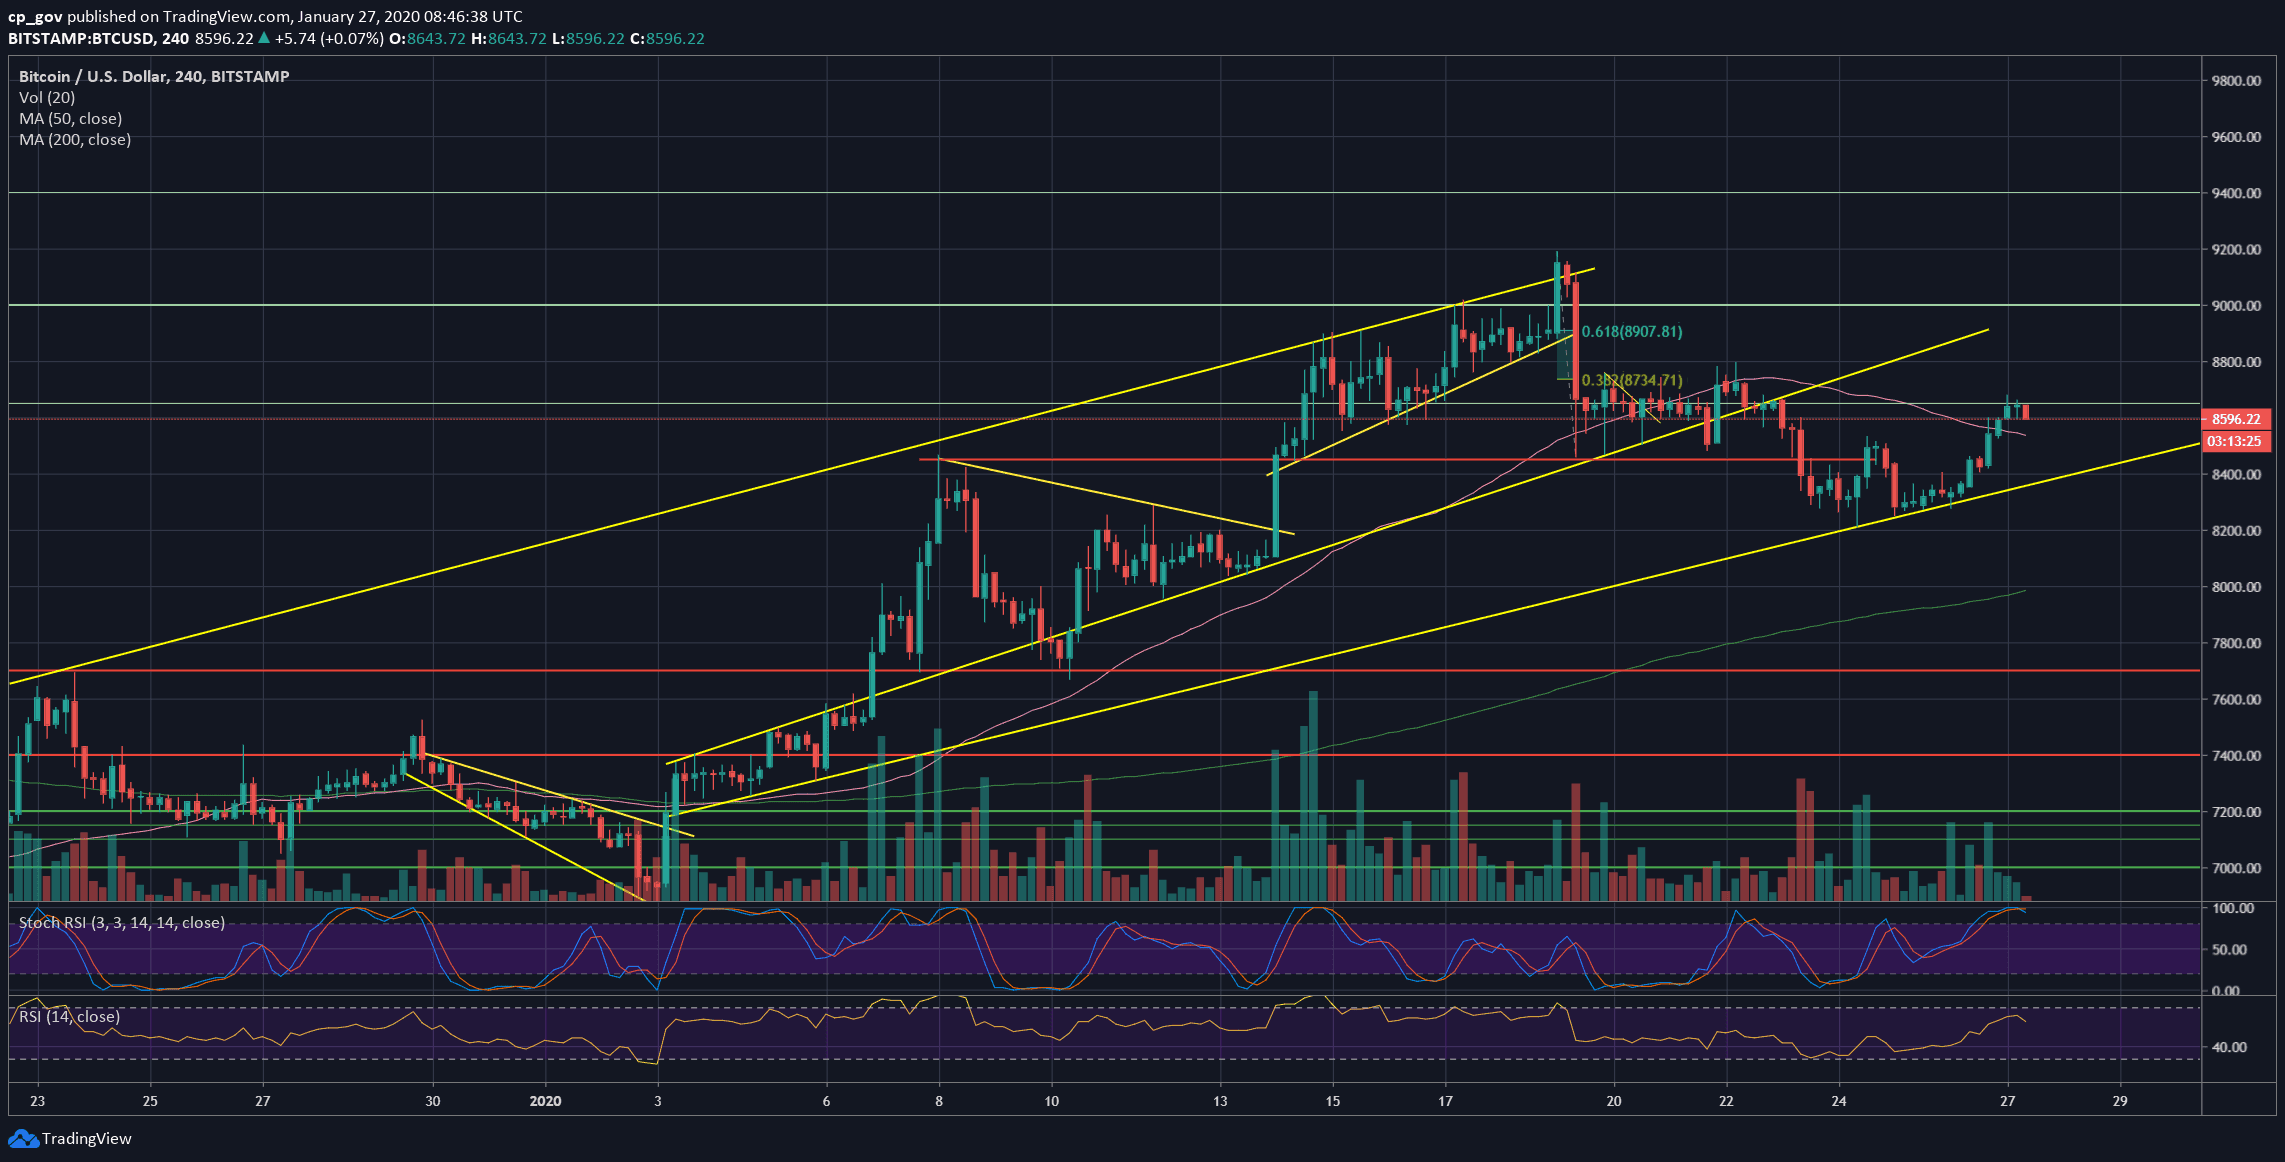
Added to the above, is the fact that Bitcoin had found support precisely on the lower trend-line of the ascending channel, marked on the following 4-hour’s chart.
Over the past 24 hours, we had seen Bitcoin gaining momentum to break above the mentioned $8400 – $8450 resistance, and quickly surging back to the $8600 support turned resistance price area.
As of writing these lines, Bitcoin is trading for hours around the critical resistance area. A break here and Bitcoin is likely to jump to the next target level of $8800 – $8900 which contains the significant 200-days moving average line (~$8915 as of writing these lines).
Total Market Cap: $238.9 billion
Bitcoin Market Cap: $157.1 billion
BTC Dominance Index: 65.8%
*Data by CoinGecko
Key Levels To Watch & Next Targets
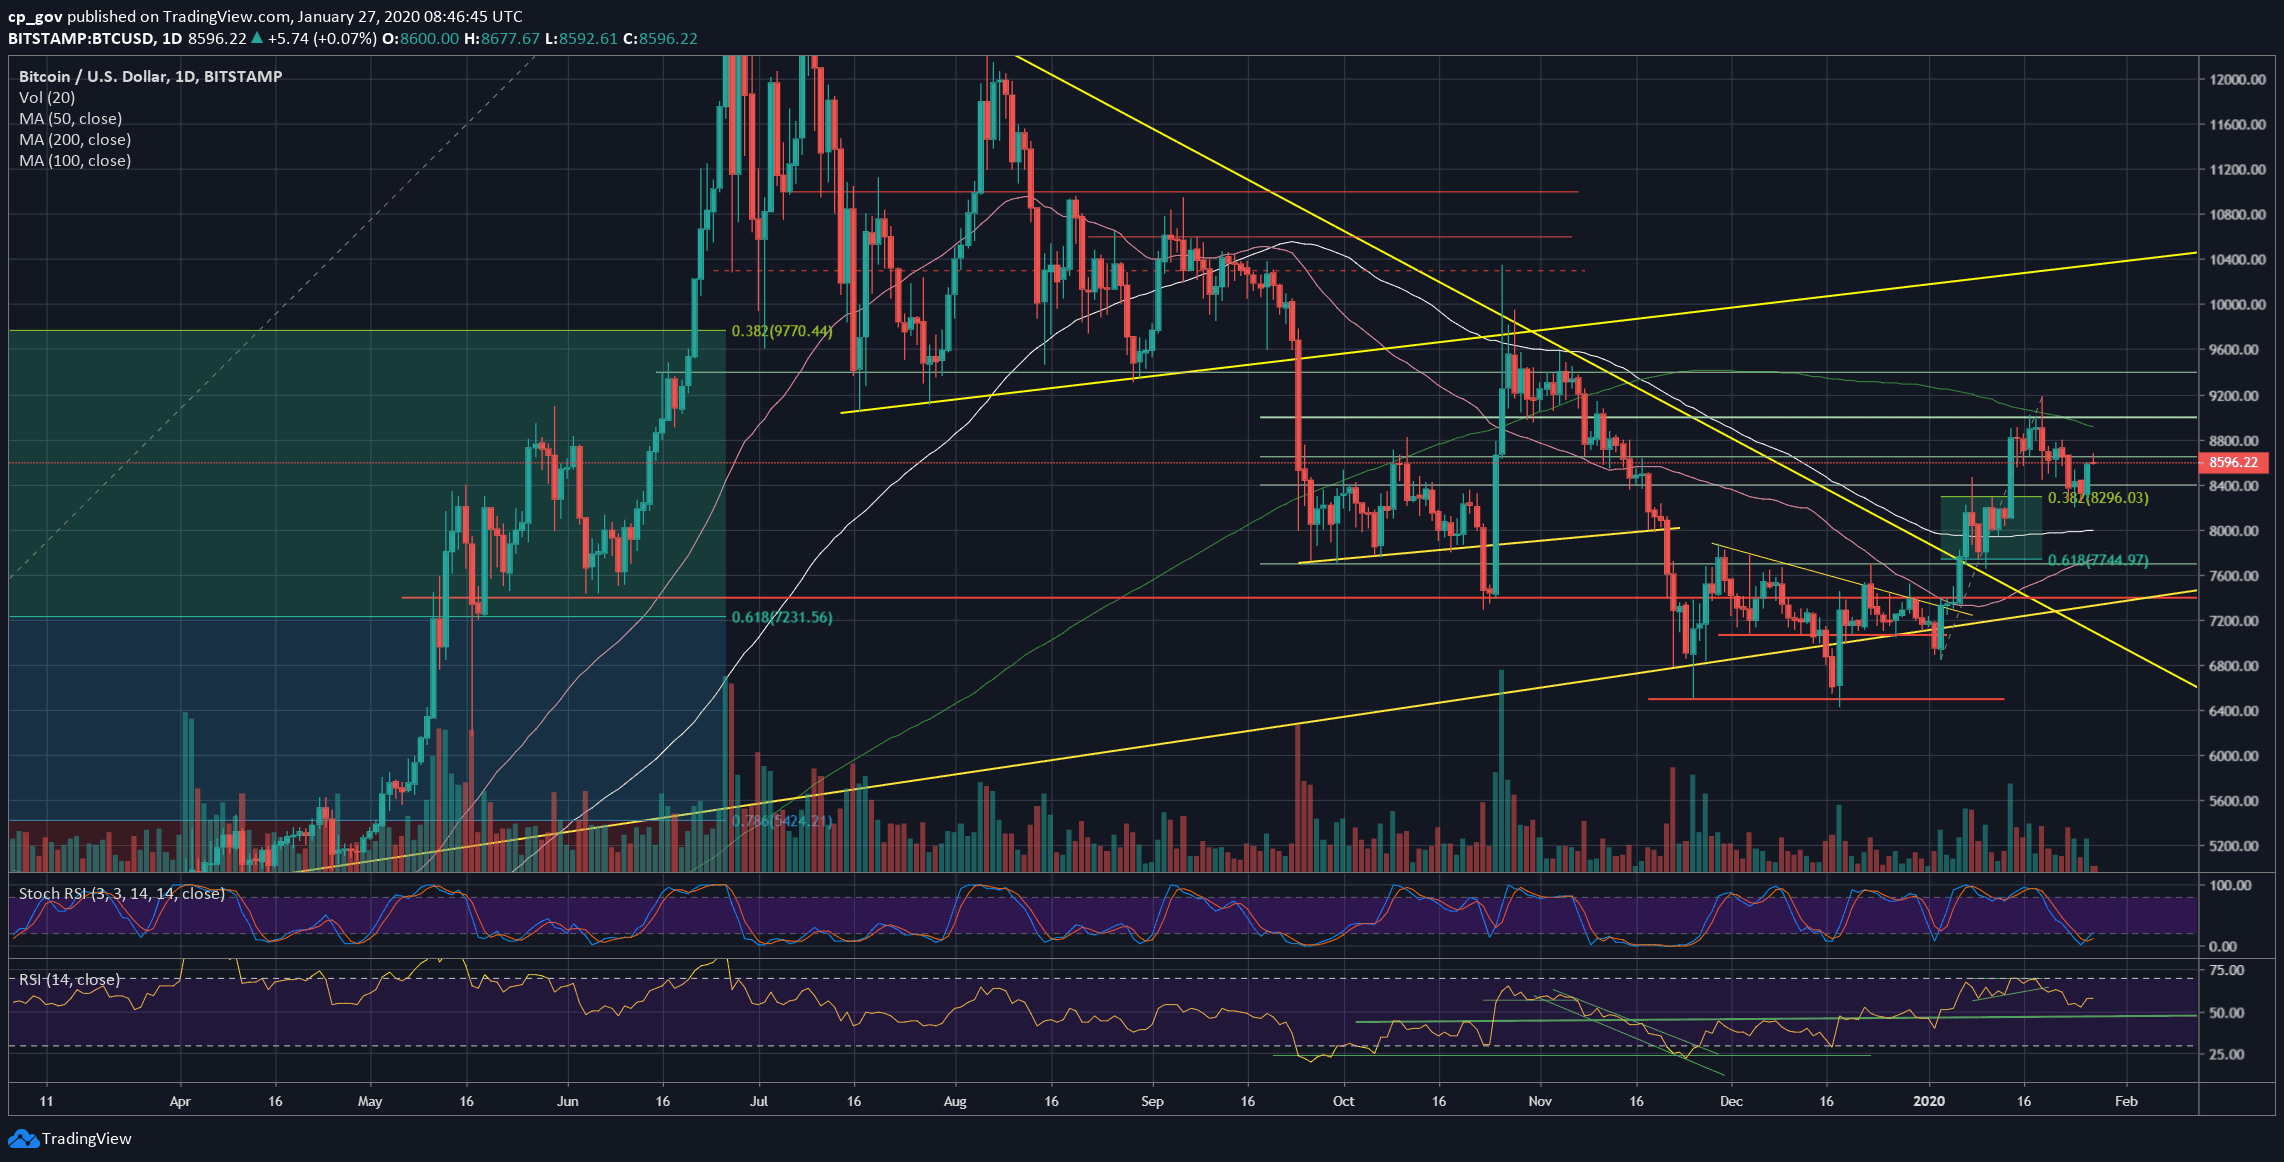
– Support/Resistance levels: Bitcoin is now facing the $8600 price area, further above lies $8800 and $8900, which includes the significant 200-days moving average line (marked by the light green line on the following daily chart). The following resistance will be the $9000 zone, followed by $9200.
From below, the first level of support is the 4-hour’s MA-50 line (marked pink, currently around $8530). The next level of support is $8400 – $8450, which was the resistance of yesterday. Further below is the weekly low at $8200, before reaching the $8000 area, which contains the 100-days moving average line (the white line).
– The RSI Indicator: After finding decent support at 54-55 RSI levels, together with the cross-over mentioned here yesterday of the Stochastic RSI oscillator, the indicator is pointing higher.
– Trading volume: The volume is relatively low over the past days, the Chinese Holidays can explain this.
BTC/USD BitStamp 4-Hour Chart
BTC/USD BitStamp 1-Day Chart
The post Bitcoin Price Analysis: Following $300 Daily Gains, Can The Bullish Momentum Drive BTC Beyond $9,000? appeared first on CryptoPotato.