Bitcoin Price Analysis Feb.28: BTC Proves Strength Coming Back From a $150 Deep
Over the past two days, besides an intra-candle quick glitch and rebound, BTC had been consolidating between the tight range around the $3800 mark.
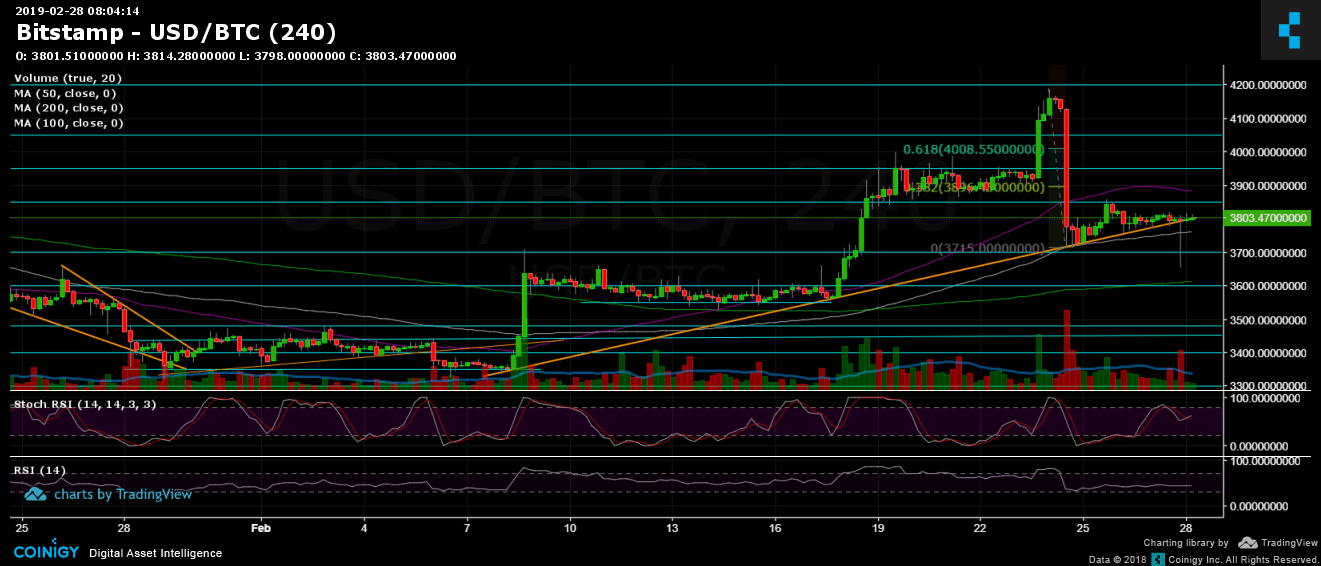
The mentioned glitch can be seen on the 4-hour chart whereas Bitcoin sled down to $3650 and quickly bought back up to the $3800 area. This could have happened following a massive sell order. However, a positive outcome is that the sell-off got quickly bought up by the bulls.
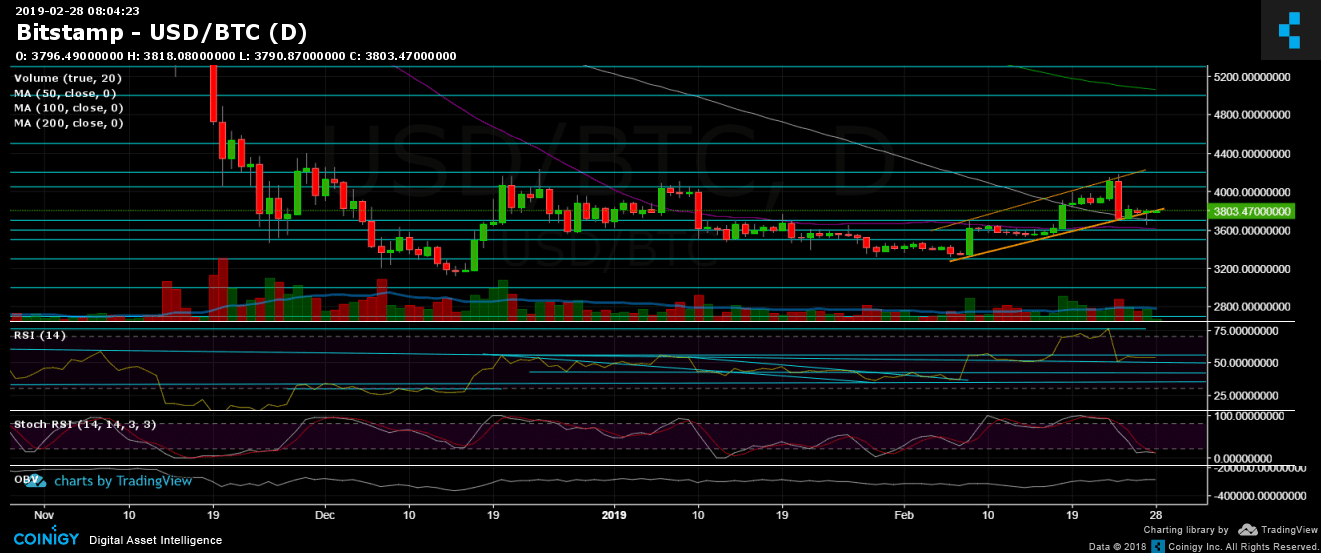
Looking at the 4-hour and the 1-day chart, we can see that the ascending trend-line is still strong and alive. However, BTC will have to overcome the $3850 level in order to return to the bullish territory for the short-term.
Total Market Cap: $130 Billion
BTC Dominance: 52.1%
Looking at the 1-day & 4-hour charts
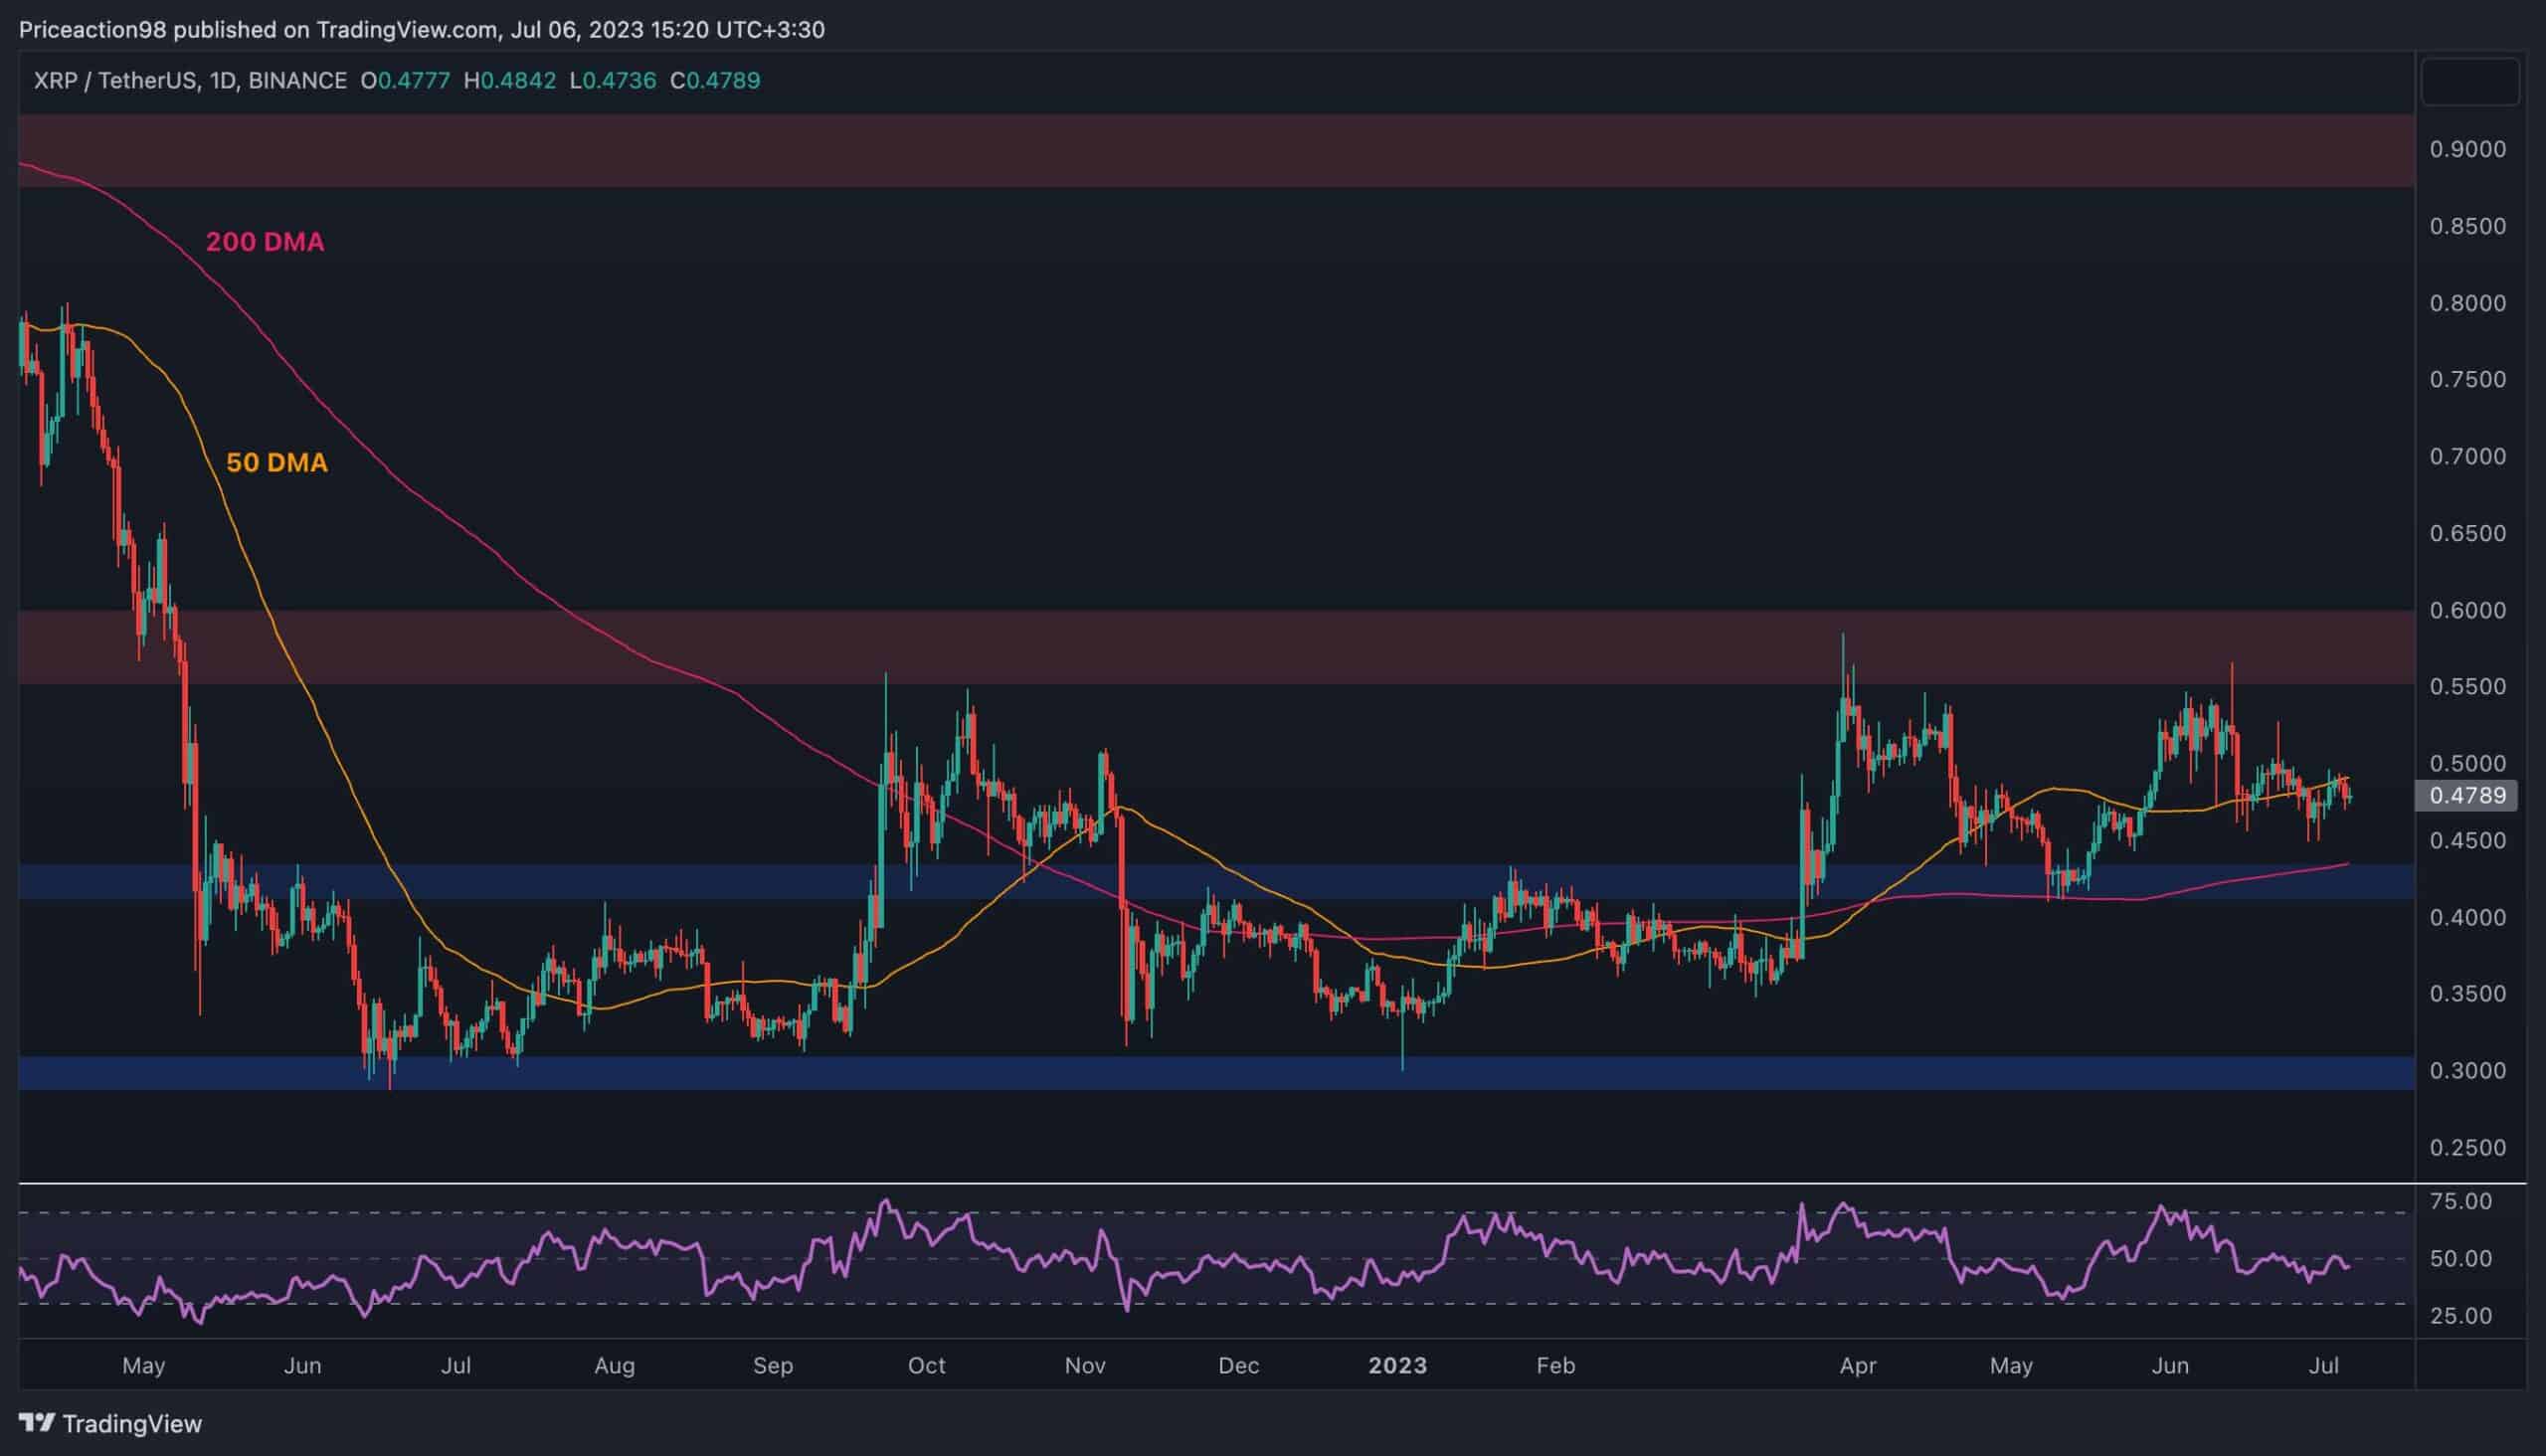
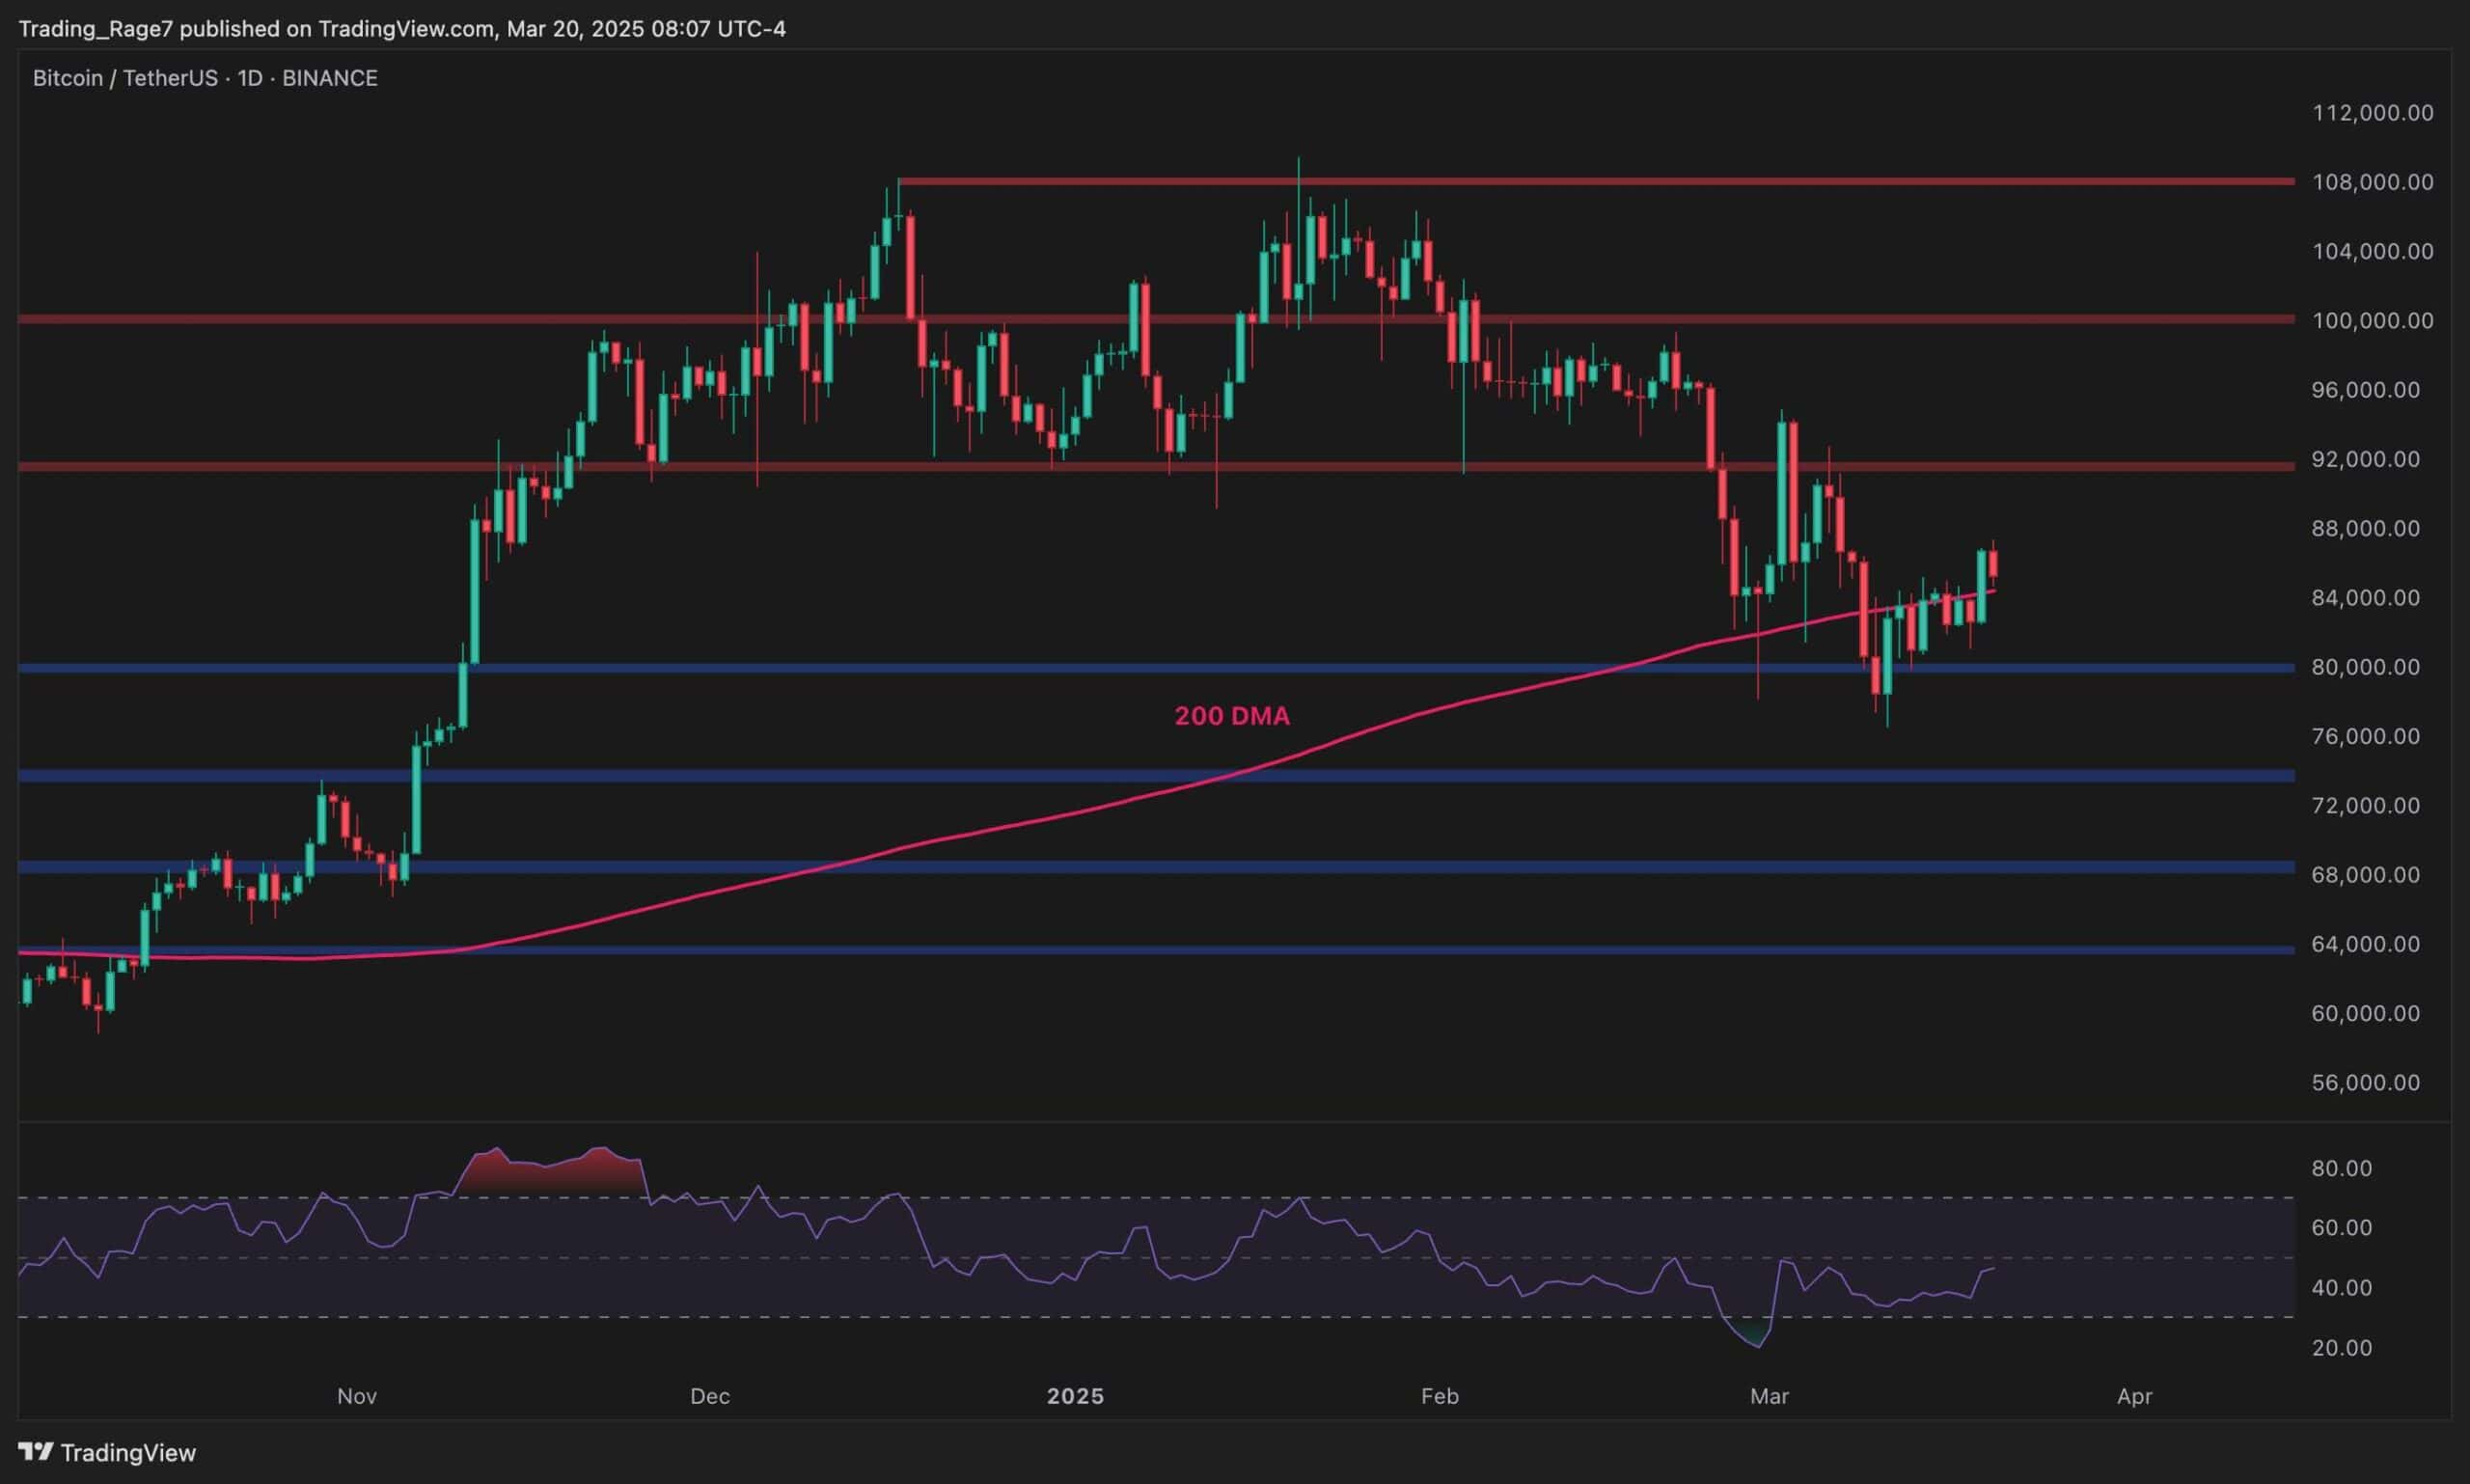
– Support/Resistance: The bigger picture hasn’t changed much since our previous update as we can see that, besides the ascending trend-line (at current BTC level), the next significant support level is the 4-hour’s 100-days moving average line currently around $3760 (marked in white). Below lies the $3700 support level, before getting to $3600 (along with the 4-hour MA-200) and the famous $3480 – $3500 support area.
From the bull side, support turned resistance levels at $3850, $3900 (along with the 4-hour 50-MA) and $4050.
– The daily chart’s RSI level: The Stochastic RSI Oscillator is about to cross over at the oversold area. In case this plays out, we can expect a bullish move which could break-up the significant $3850 resistance.
– The daily trading volume: Following the tight consolidation range, so as the low amount of trading volume.
– BitFinex open short positions: This tells another exciting story whereas BTC short positions have returned above the critical 19K line. The shorts level is at $19,170 BTC: Still in a fragile and unexpected area.
BTC/USD BitStamp 4-Hour chart
BTC/USD BitStamp 1-Day chart
The post Bitcoin Price Analysis Feb.28: BTC Proves Strength Coming Back From a $150 Deep appeared first on CryptoPotato.