Bitcoin Price Analysis Feb.24: Bitcoin Seems Bullish Following $4K Breakout. What’s Next?
Following five days of consolidation between the tight range of $3850 to $3950, finally, the bulls managed to gain momentum and break up the desired $4,000 mark. The weekend is an excellent time for Bitcoin’s major moves when many heavy traders and market makers are off to their weekend vacation.
As anticipated on our previous analysis, the break-up quickly sent Bitcoin to re-test major resistance level at $4200 (Bitcoin touched $4190 on Bitstamp).
The market cap of all cryptocurrencies had reached $143 Billion, whereas BTC dominance is 51.3% (Bitcoin share of the total market cap).
Looking at the 1-day & 4-hour charts
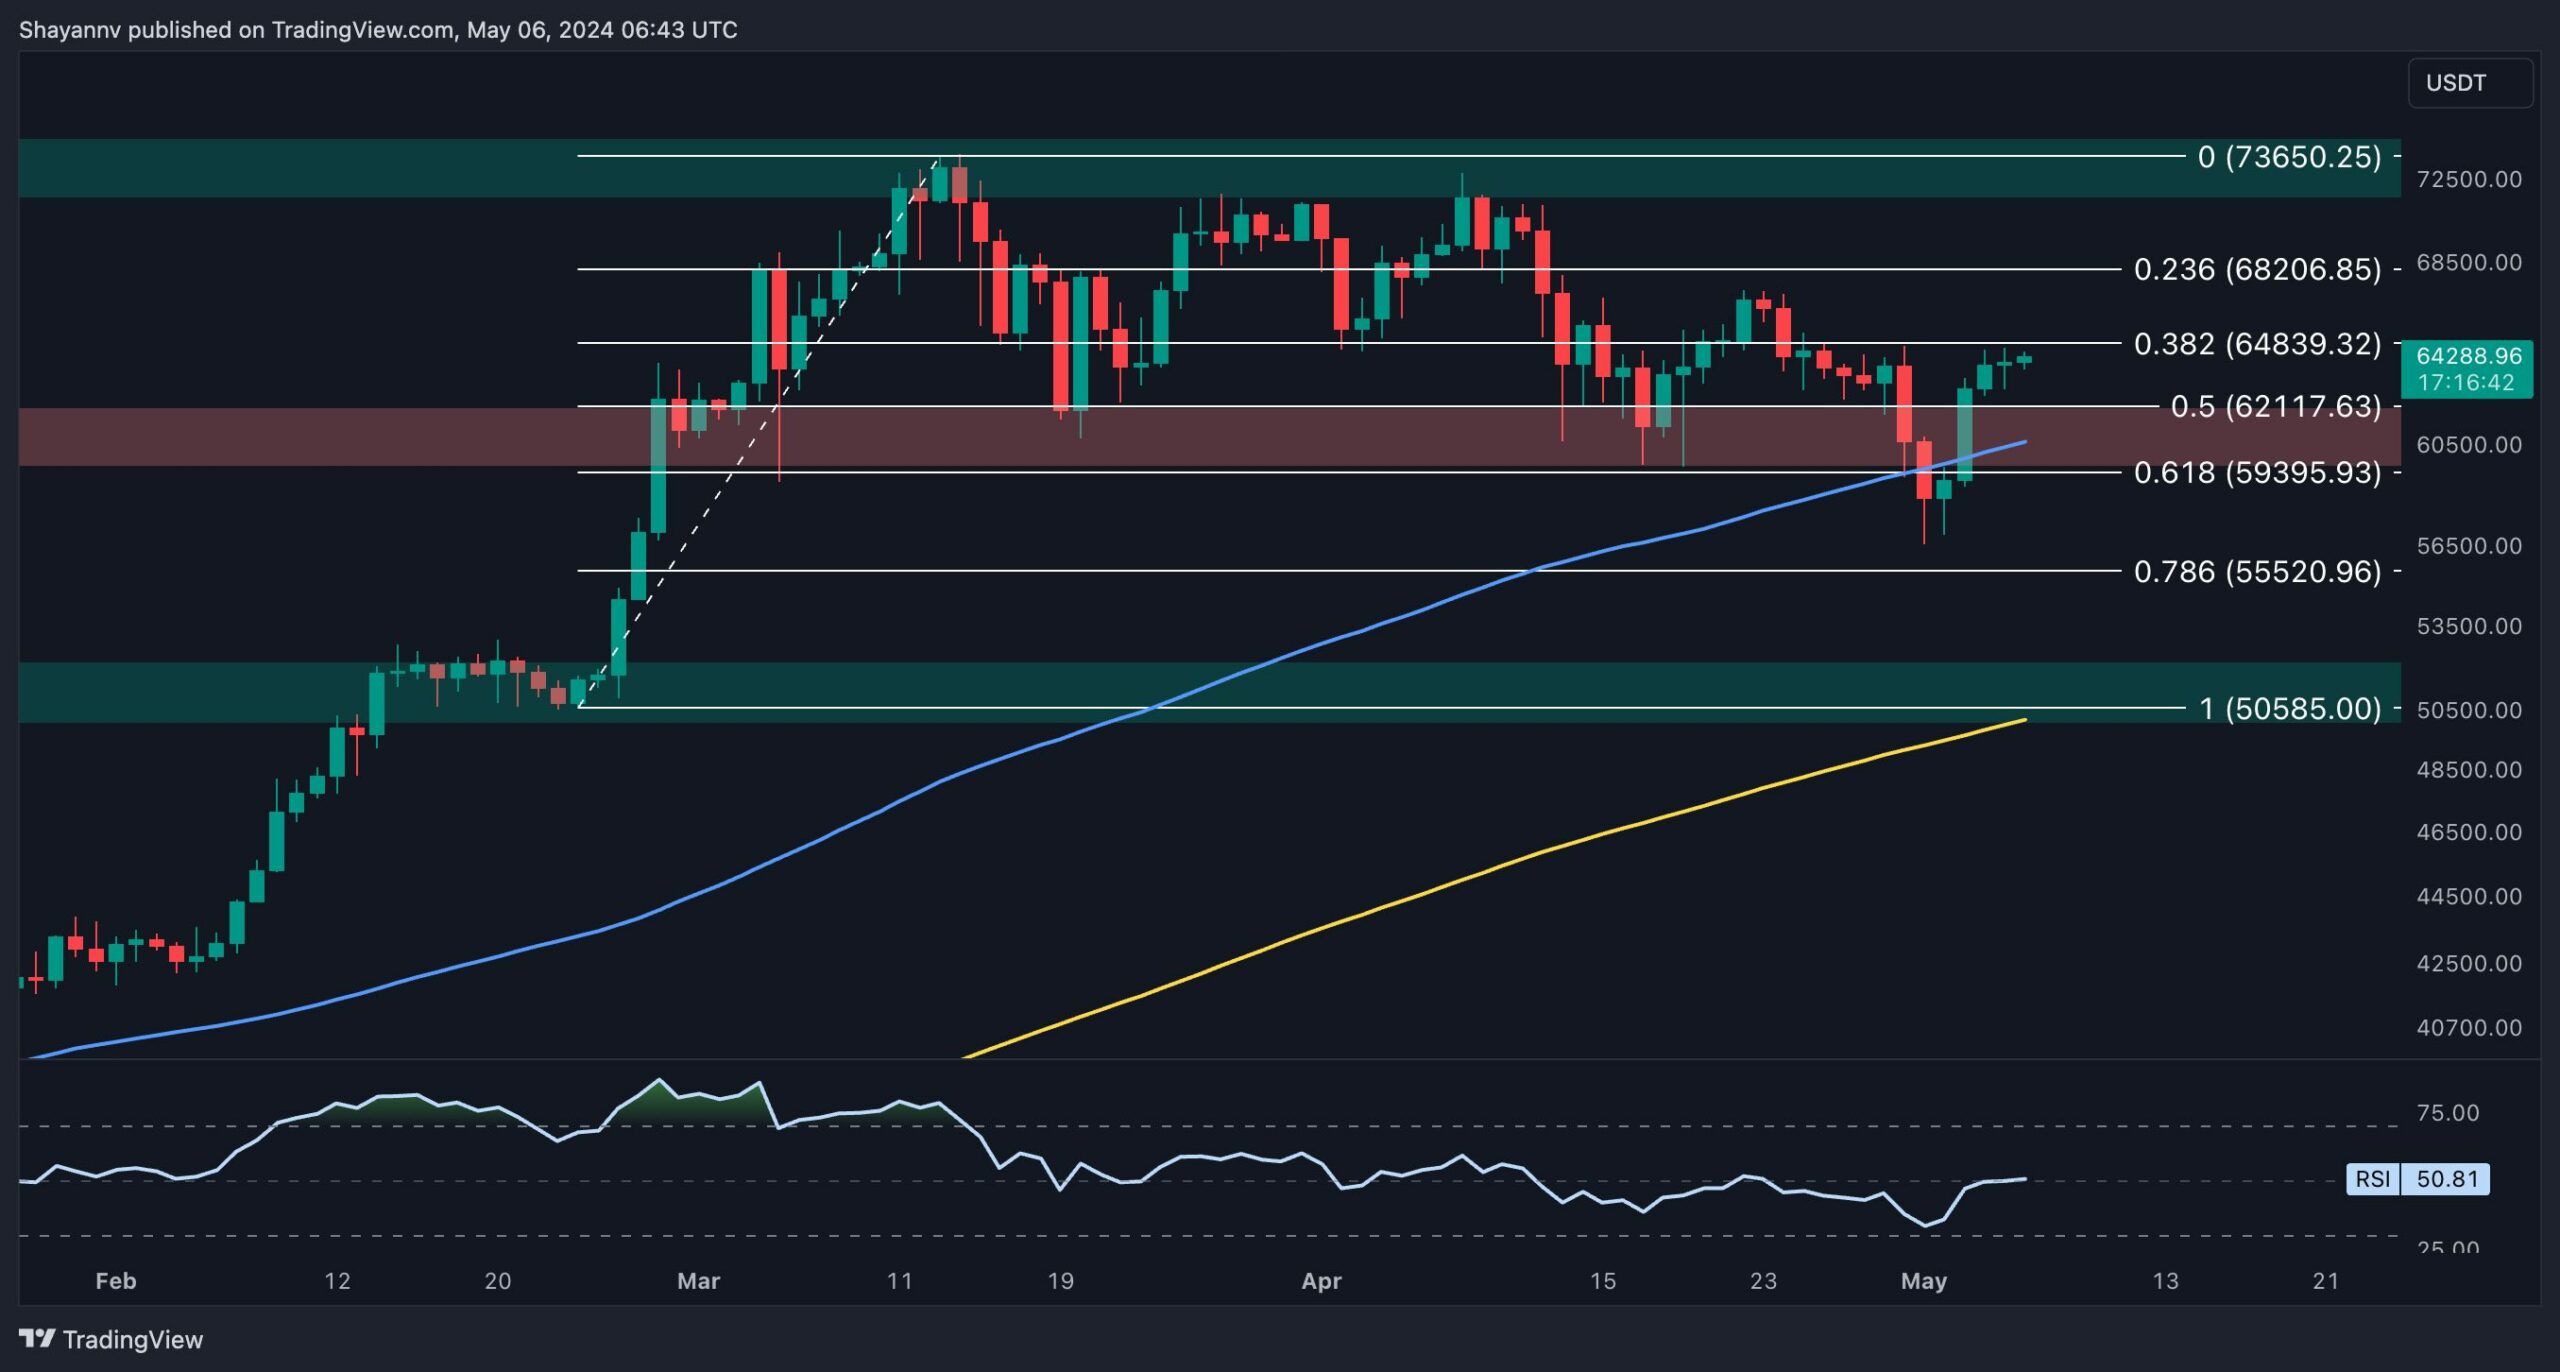
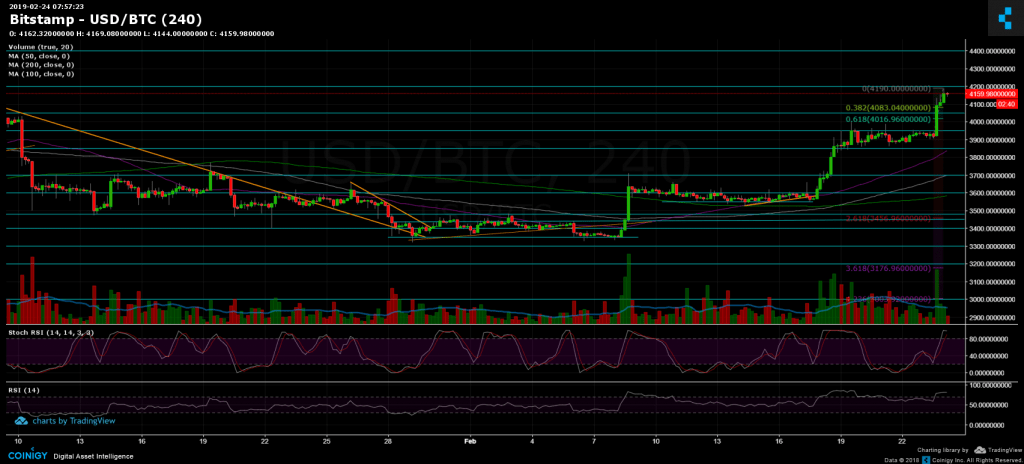
– Support/Resistance: Following the break-up of $3950 and $4050, Bitcoin is now facing the significant $4200 level, which is not expected to be so easy to breach. A break-up of $4200 and the next resistance should be $4300 and $4400.
From below, support levels lie at $4083 (Fib level 38.2%), resistance turned support level at $4050, $4000 – $4016 (Fib level 61.8%), and resistance turned support $3950, before getting back to the range of $3850 (along with the 4-hour chart’s 50-days moving average line, marked in purple).
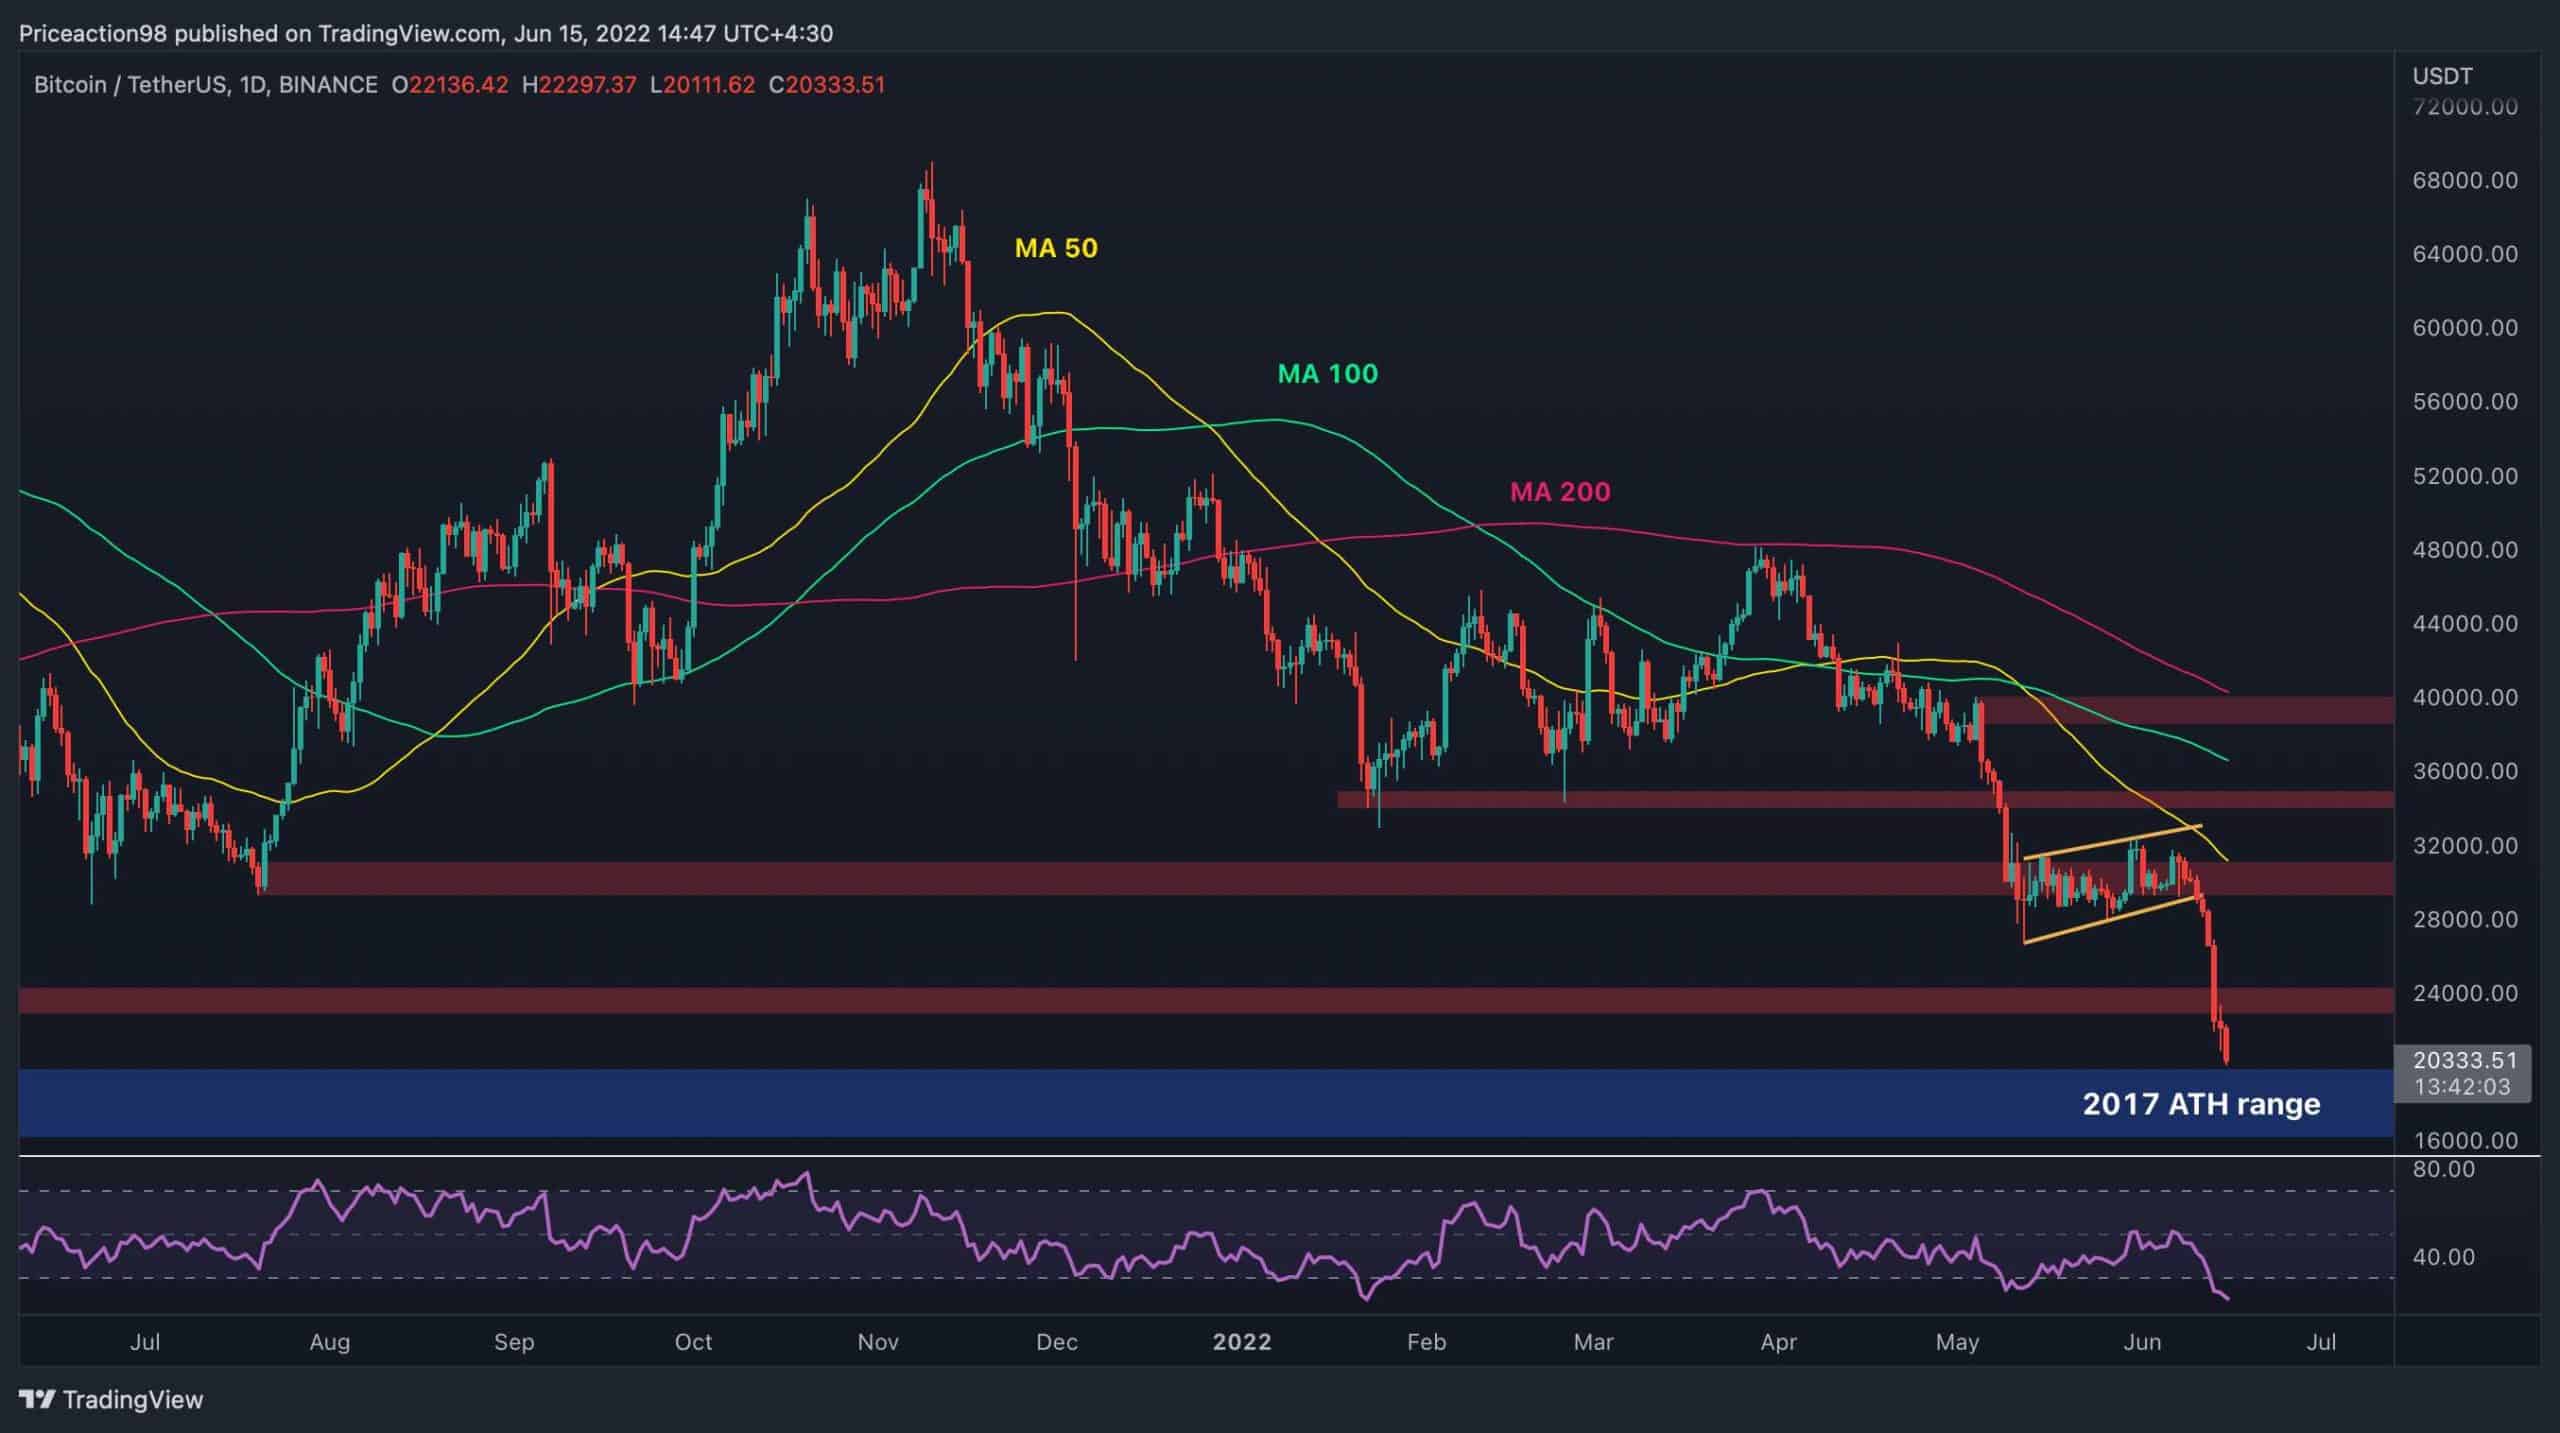
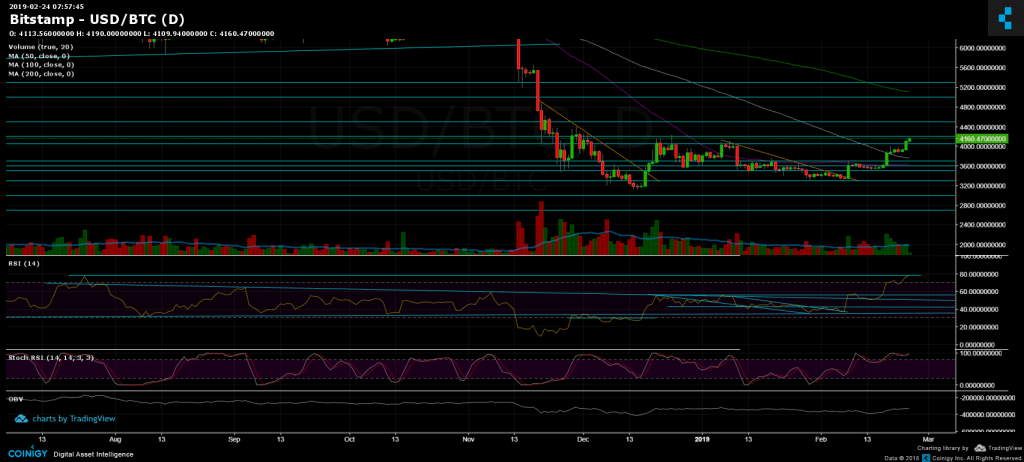
– The RSI levels are over-stretched. As can be seen on the daily chart, the RSI had reached a high of 78 (resistance). The last time the RSI touched 78 was during July 2018, when Bitcoin was equal almost $8000.
– The 4-hour Stochastic RSI oscillator is about to cross over in the overbought area. In case it crosses, it might lead a short-term correction down to the mentioned support levels (reasonable after such rally).
– The daily trading volume: Of the past nine days, eight days ended positively in green. This is starting to look like a bull-market formation. However, the volume of yesterday was not significant; This could be due to the weekend.
– BitFinex open short positions: The 19K line is still holding firm. As can be seen here, this long term horizontal support line started forming since May 2018.
BTC/USD BitStamp 4-Hour chart
BTC/USD BitStamp 1-Day chart
The post Bitcoin Price Analysis Feb.24: Bitcoin Seems Bullish Following $4K Breakout. What’s Next? appeared first on CryptoPotato.