Bitcoin Price Analysis Feb.18: BTC Looks Bullish Breaking Up The $3600 (As of now)
In yesterday’s analysis, when Bitcoin was struggling with the $3600 resistance mark, we’ve stated that Bitcoin was consolidating and very soon a significant move is expected. Also, we’ve reported that there are very high chances for a bullish move.
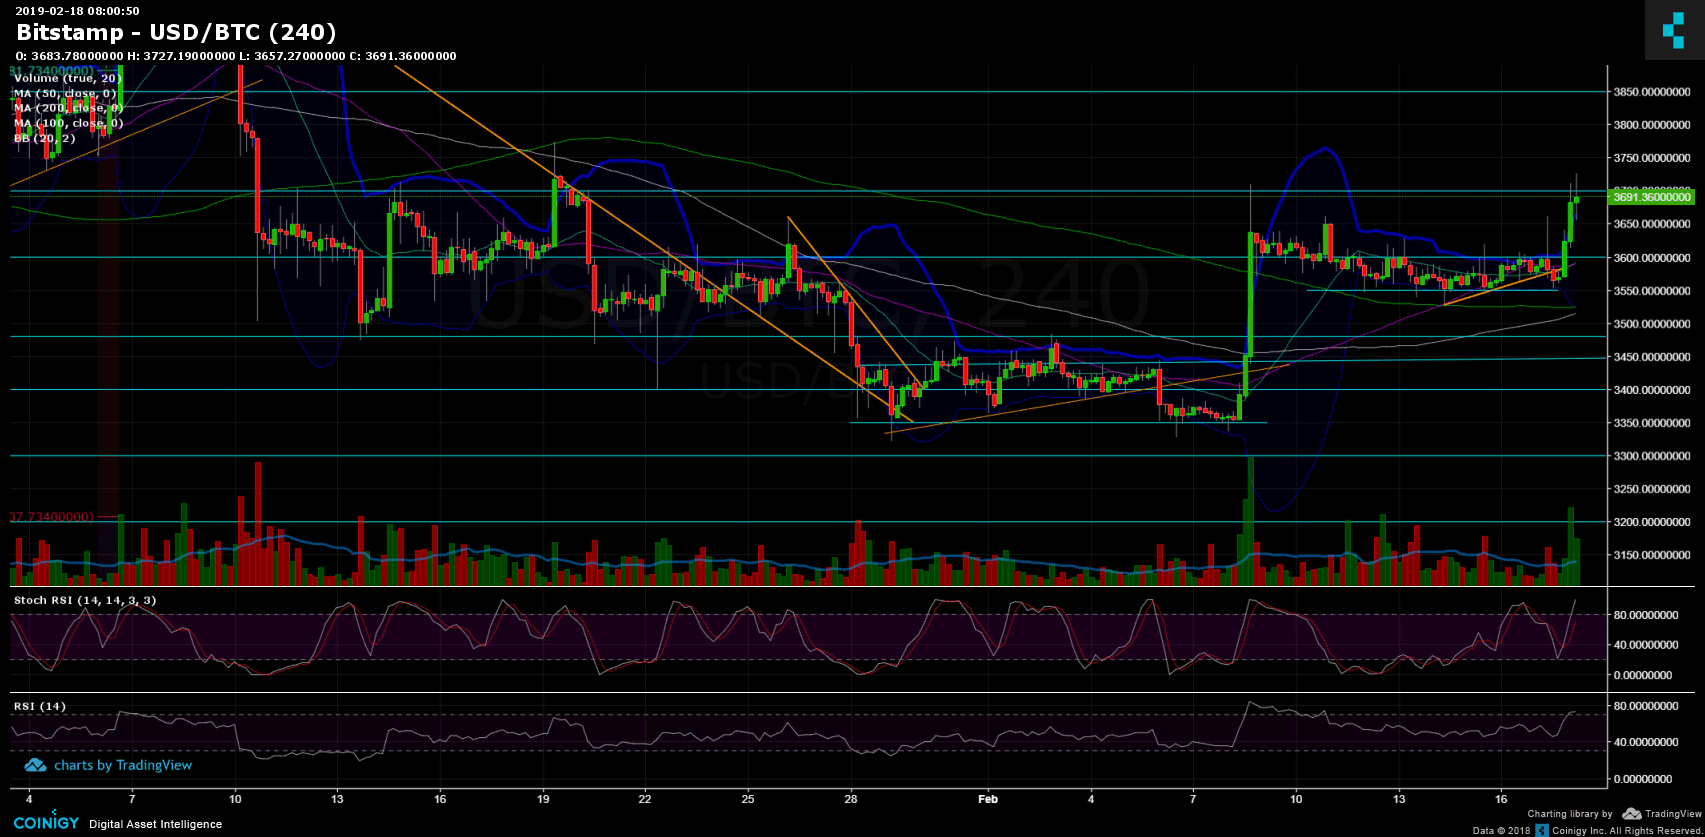
After a false breakout of the bullish 4-hour chart’s triangle, which could have easily turned into a bulls trap, for the past 12 hours we’ve seen the real breakout (as far as seen now).
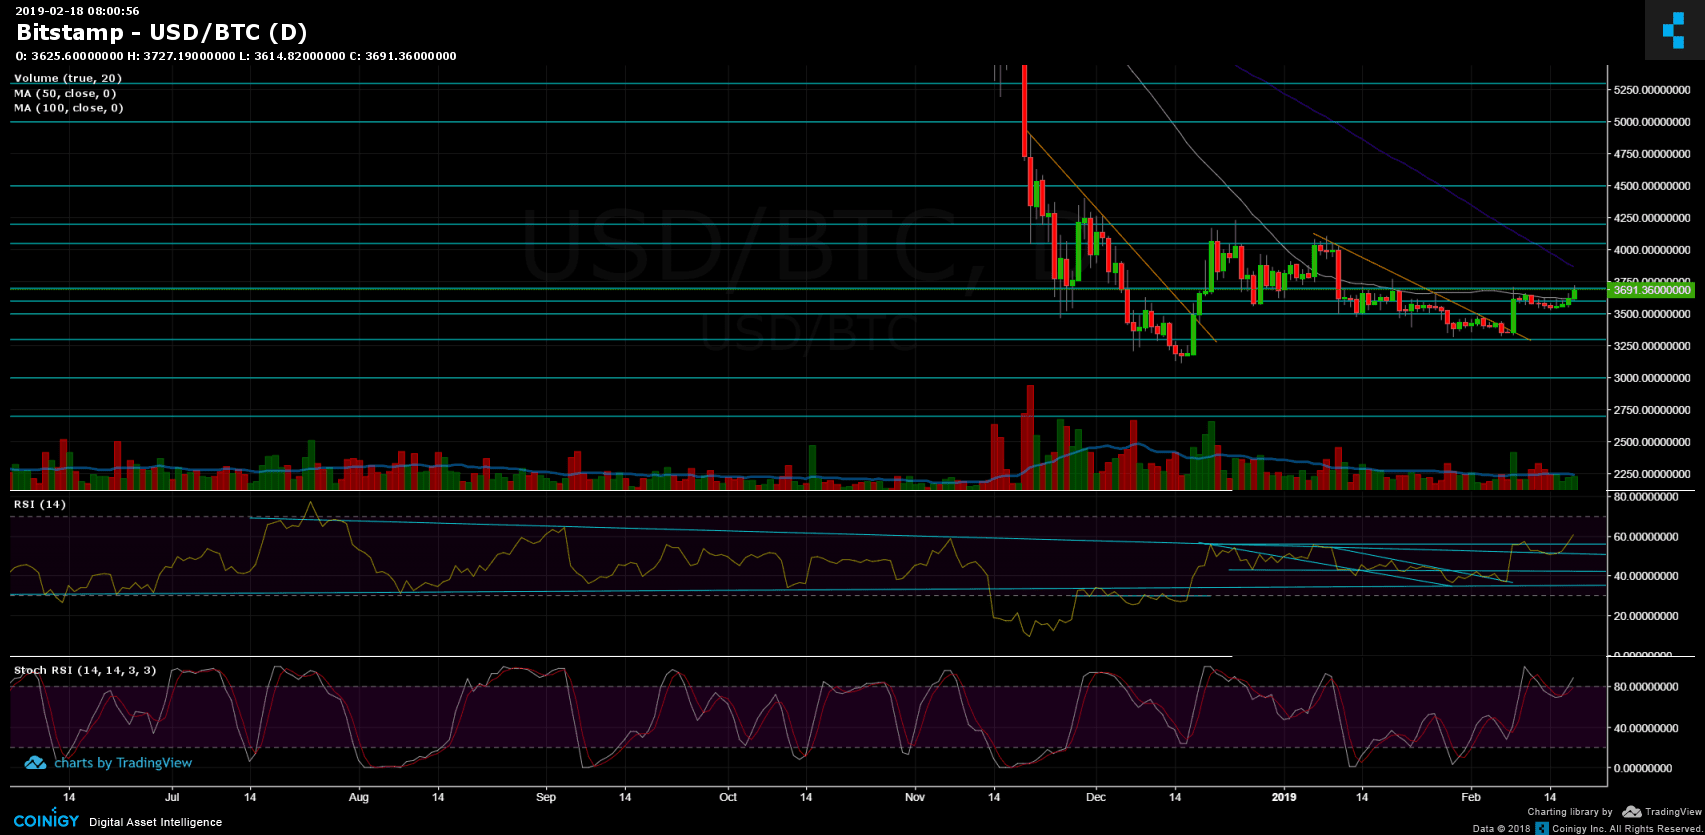
As of now, the significant resistance of the 50-days moving average line (daily chart, marked in white) had been broken up. For a bullish continuation, it’s crucial how this daily candle will close.
Looking at the 1-day & 4-hour charts
– Following the mentioned breakout, Bitcoin is now facing the $3700 tough resistance mark. The $3700 level probably won’t be so easy to breach: For the past month and a half, Bitcoin was under $3700, following a few tryouts to break-up. Further resistance is located in the $3800 – $3850 area, before reaching the $4K zone.
– However, the odd volatile move (compared to the last ten consolidation days) might need some air to continue. The RSI levels are around the overbought area, whereas support levels lie at $3650, $3600 (along with the daily MA-50) and $3500.
– Looking at the daily chart’s RSI: Finally, the RSI broke up the 56 mark, and reached a high of 61. The last time the RSI passed 60 was around the beginning of September 2018, when BTC was priced more than $7,000 a coin.
– The trading volume seems to be higher than of the past days, but as mentioned, we would need to see how this daily candle closes.
– BitFinex’s open short positions increased to 25.20K BTC of open positions.
BTC/USD BitStamp 4-Hour chart
BTC/USD BitStamp 1-Day chart
The post Bitcoin Price Analysis Feb.18: BTC Looks Bullish Breaking Up The $3600 (As of now) appeared first on CryptoPotato.