Bitcoin Price Analysis Feb.10: Bitcoin Struggles To Stay Above $3600, Facing The Critical Resistance
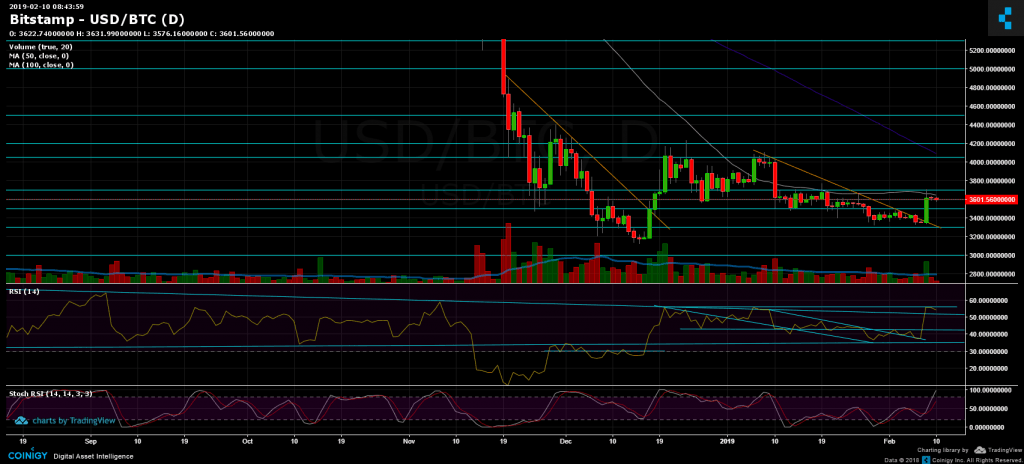
Two days ago, just an hour after publishing our previous analysis, Bitcoin broke up the mid-term descending trend-line (can be seen on the 1-day chart).
In a matter of ten hours, Bitcoin went up from $3355 to a high of $3711 (Bitstamp). As much as a 10% gain.
From there and up till now, Bitcoin had been consolidating around the $3600 level, in anticipation for the next big move.
Looking at the 1-day & 4-hour charts
- The daily chart’s RSI: RSI reached a resistance level at the 56 line, following the breakout. The last time the RSI was higher than 56 was at the beginning of November 2018 (when BTC was over $6,000). Breaking above the 56 level could signal a bullish continuation.
- Before we mention the critical levels, to my opinion, this last Bitcoin move can become a deeper correction to the upside (higher targets lie around $3800 and $4000), while there is always a high chance that this move would end up being another Bart’s head pattern going sharply back to the “base” line around $3400 – $3500.
- Support and resistance areas: Bitcoin is now facing the key-level of the 50 days moving average line on the daily chart (marked in white). This level lies around $3650. Breaking it up could lead BTC to retest higher resistance levels of $3700, $3800 and $3850.
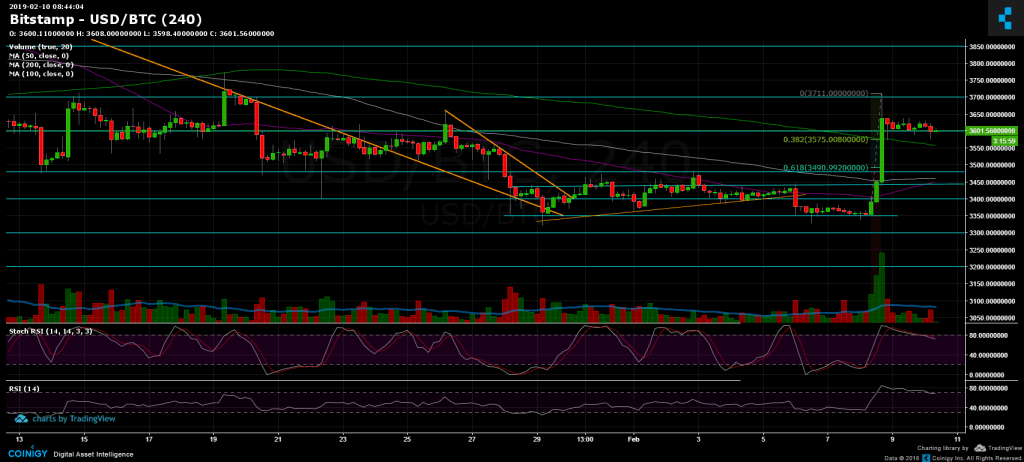
- Short-term support can be found at current price range: $3550 – $3600 (along with the 4-hour 200-days moving average line). Further below is the $3480 – $3500 strong resistance turned support area. Further lies the $3400 level.
- Fibonacci retracement levels can be found at $3575 (38.2%) and $3490 (61.8%). The two are possible support levels for a healthy correction.
- A reminder: To start thinking bullish for the mid-term, Bitcoin has to return back over the critical 50 days moving average line of the daily chart, which is hovering around $3650.
- The last rise was followed by a high amount of trading volume. In the following weekend days, the volume is back to normal/low, compared to the past month.
- BitFinex’s open short positions sharply decreased to 23.8K BTC of open positions.
BTC/USD BitStamp 4-Hour chart
BTC/USD BitStamp 1-Day chart
The post Bitcoin Price Analysis Feb.10: Bitcoin Struggles To Stay Above $3600, Facing The Critical Resistance appeared first on CryptoPotato.