Bitcoin Price Analysis: Did BTC Just Lose Major Key Support Before Further Plunge?
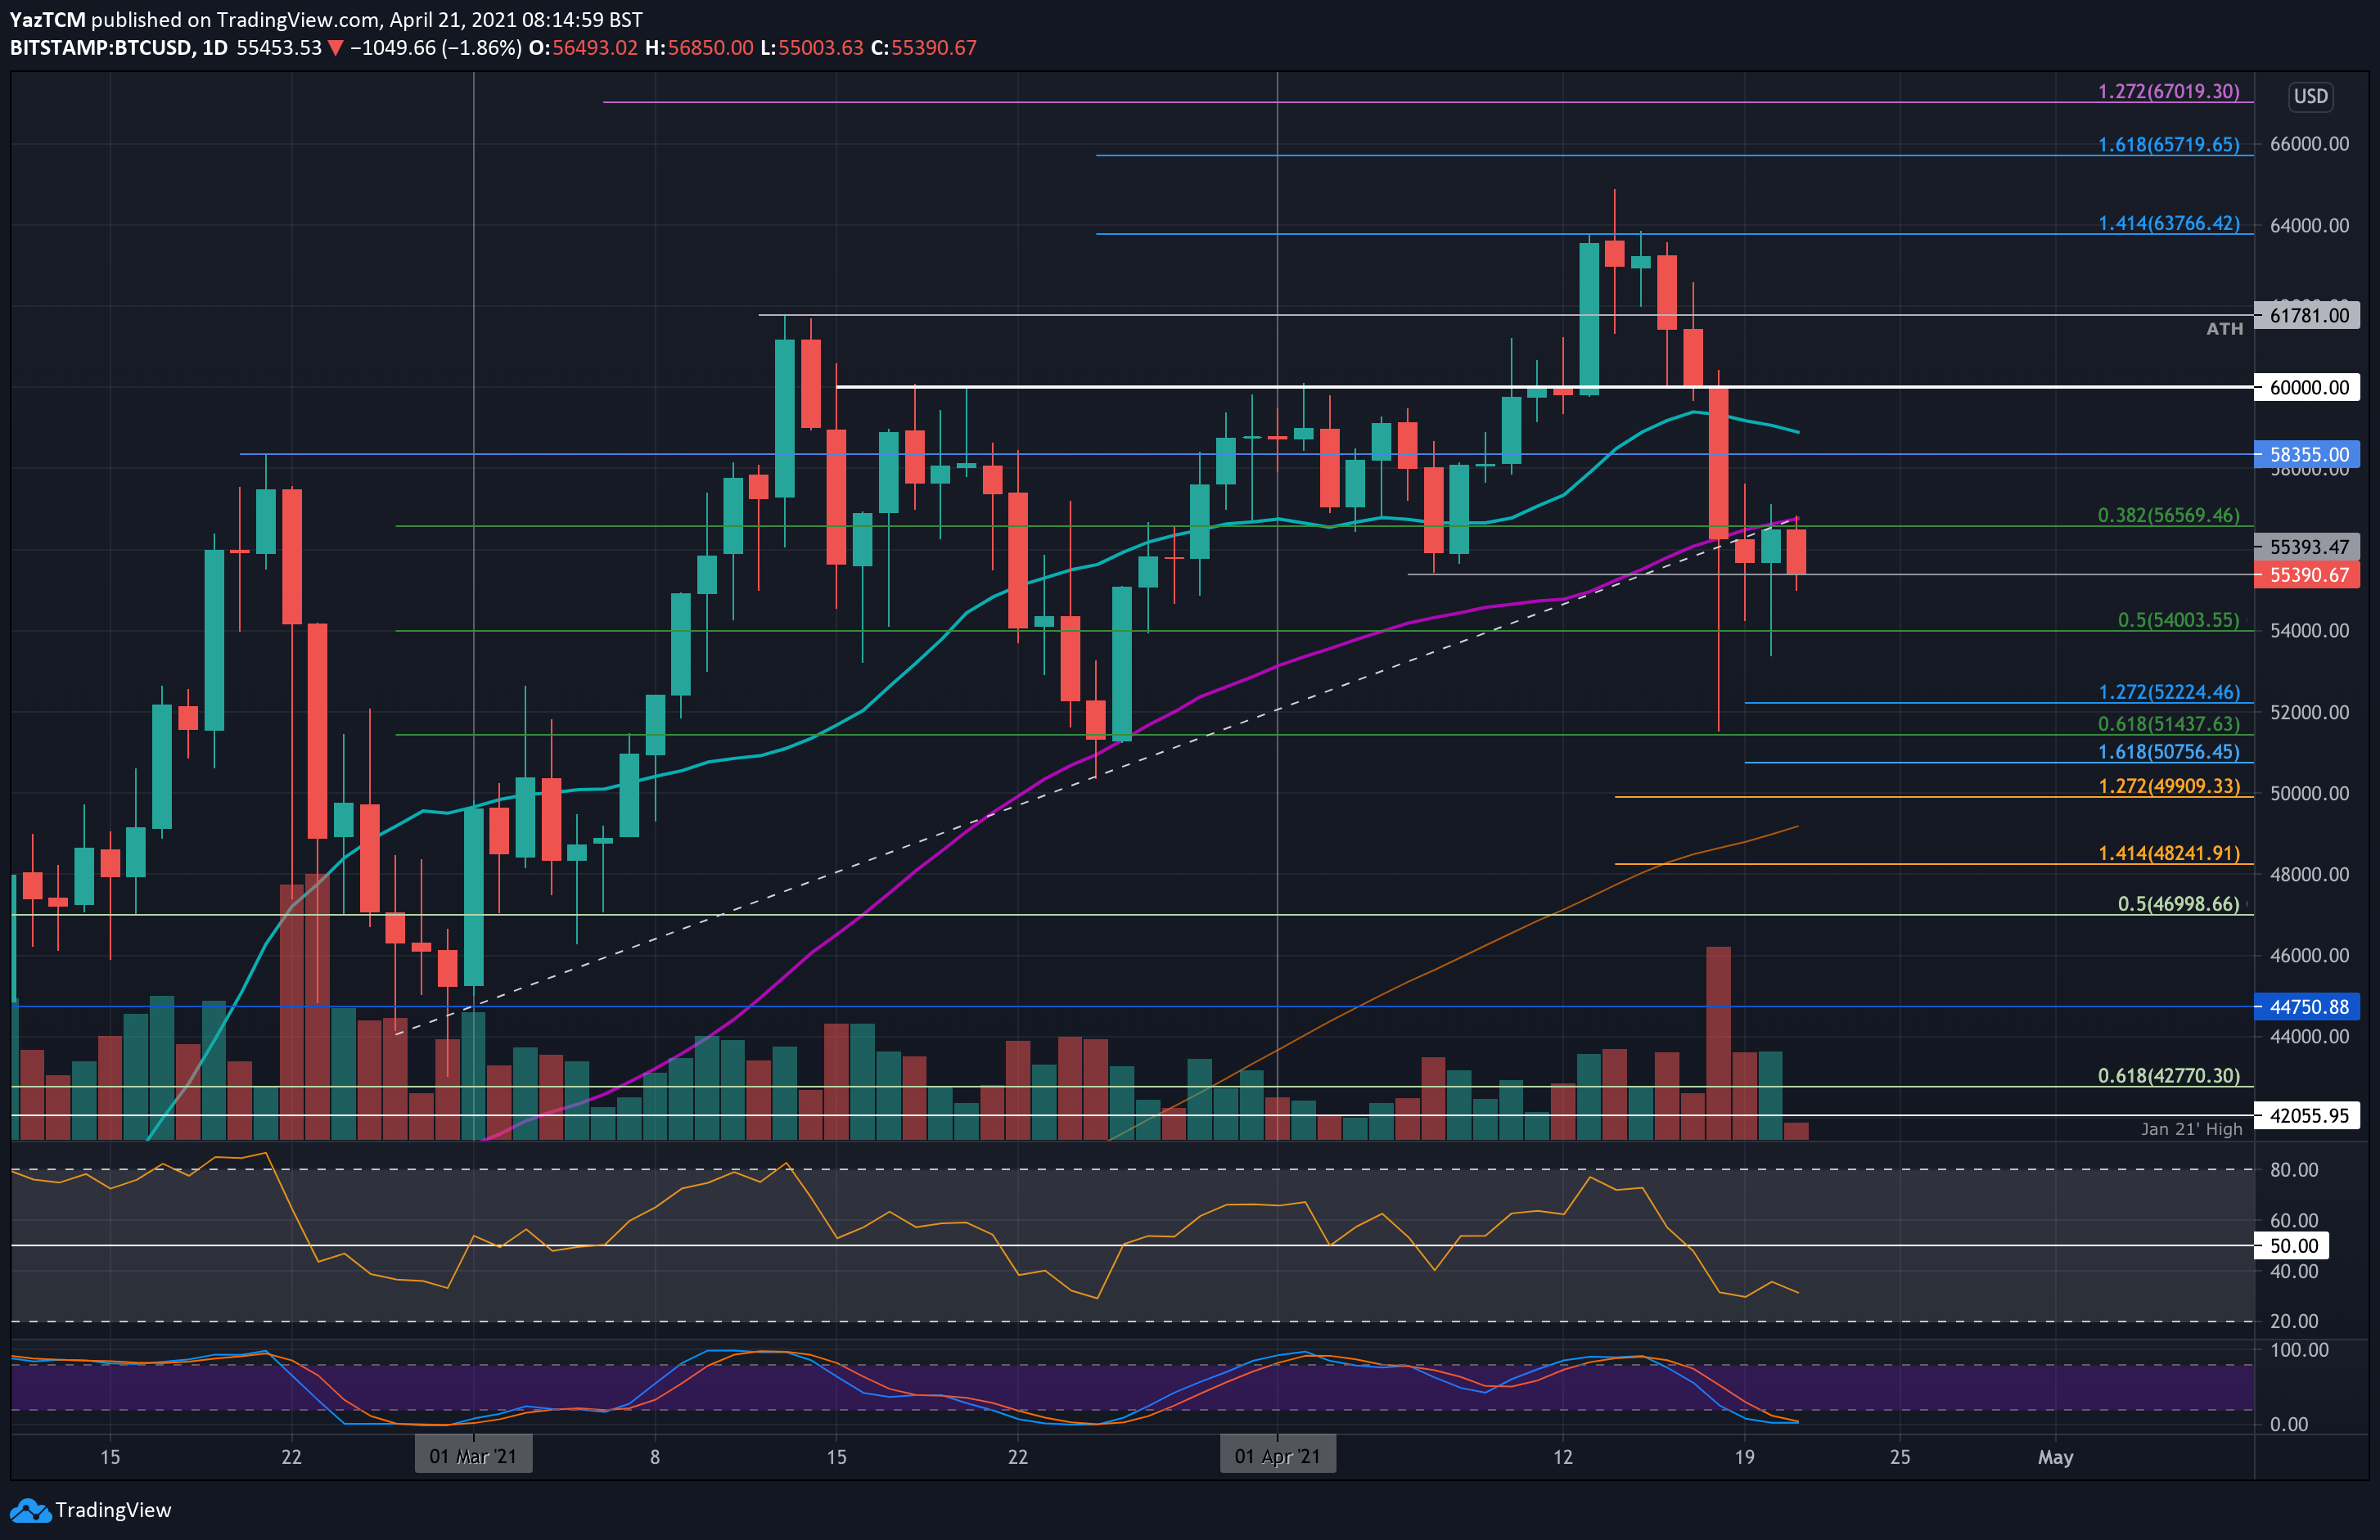
After a volatile day with some hope for the bulls, bitcoin remains in the red territory following a minor 1.5% price decrease today as the cryptocurrency battles for the critical support level at the 50-day moving average line. The latter now lies exactly where today’s highest trading price of $56,850 (Bitstamp) was.
Quick recap: BTC price had experienced a sharp 14% collapse on Sunday, causing it to drop into support near $51,440 (.618 Fib), losing $9k in a matter of hours (!). From there, bitcoin recovered to $56,275 by the end of the day, however, yesterday’s daily close was below the critical 50-day moving average line, as mentioned above.
Since then, bitcoin has struggled to above the 50-days MA. It attempted to close above the resistance yesterday but failed to do so and was turned away after reaching the critical line once again. The rejection was massive, losing over $1500 of value in a matter of hours. As of now, bitcoin trades slightly below the $55,400 level (early April support).
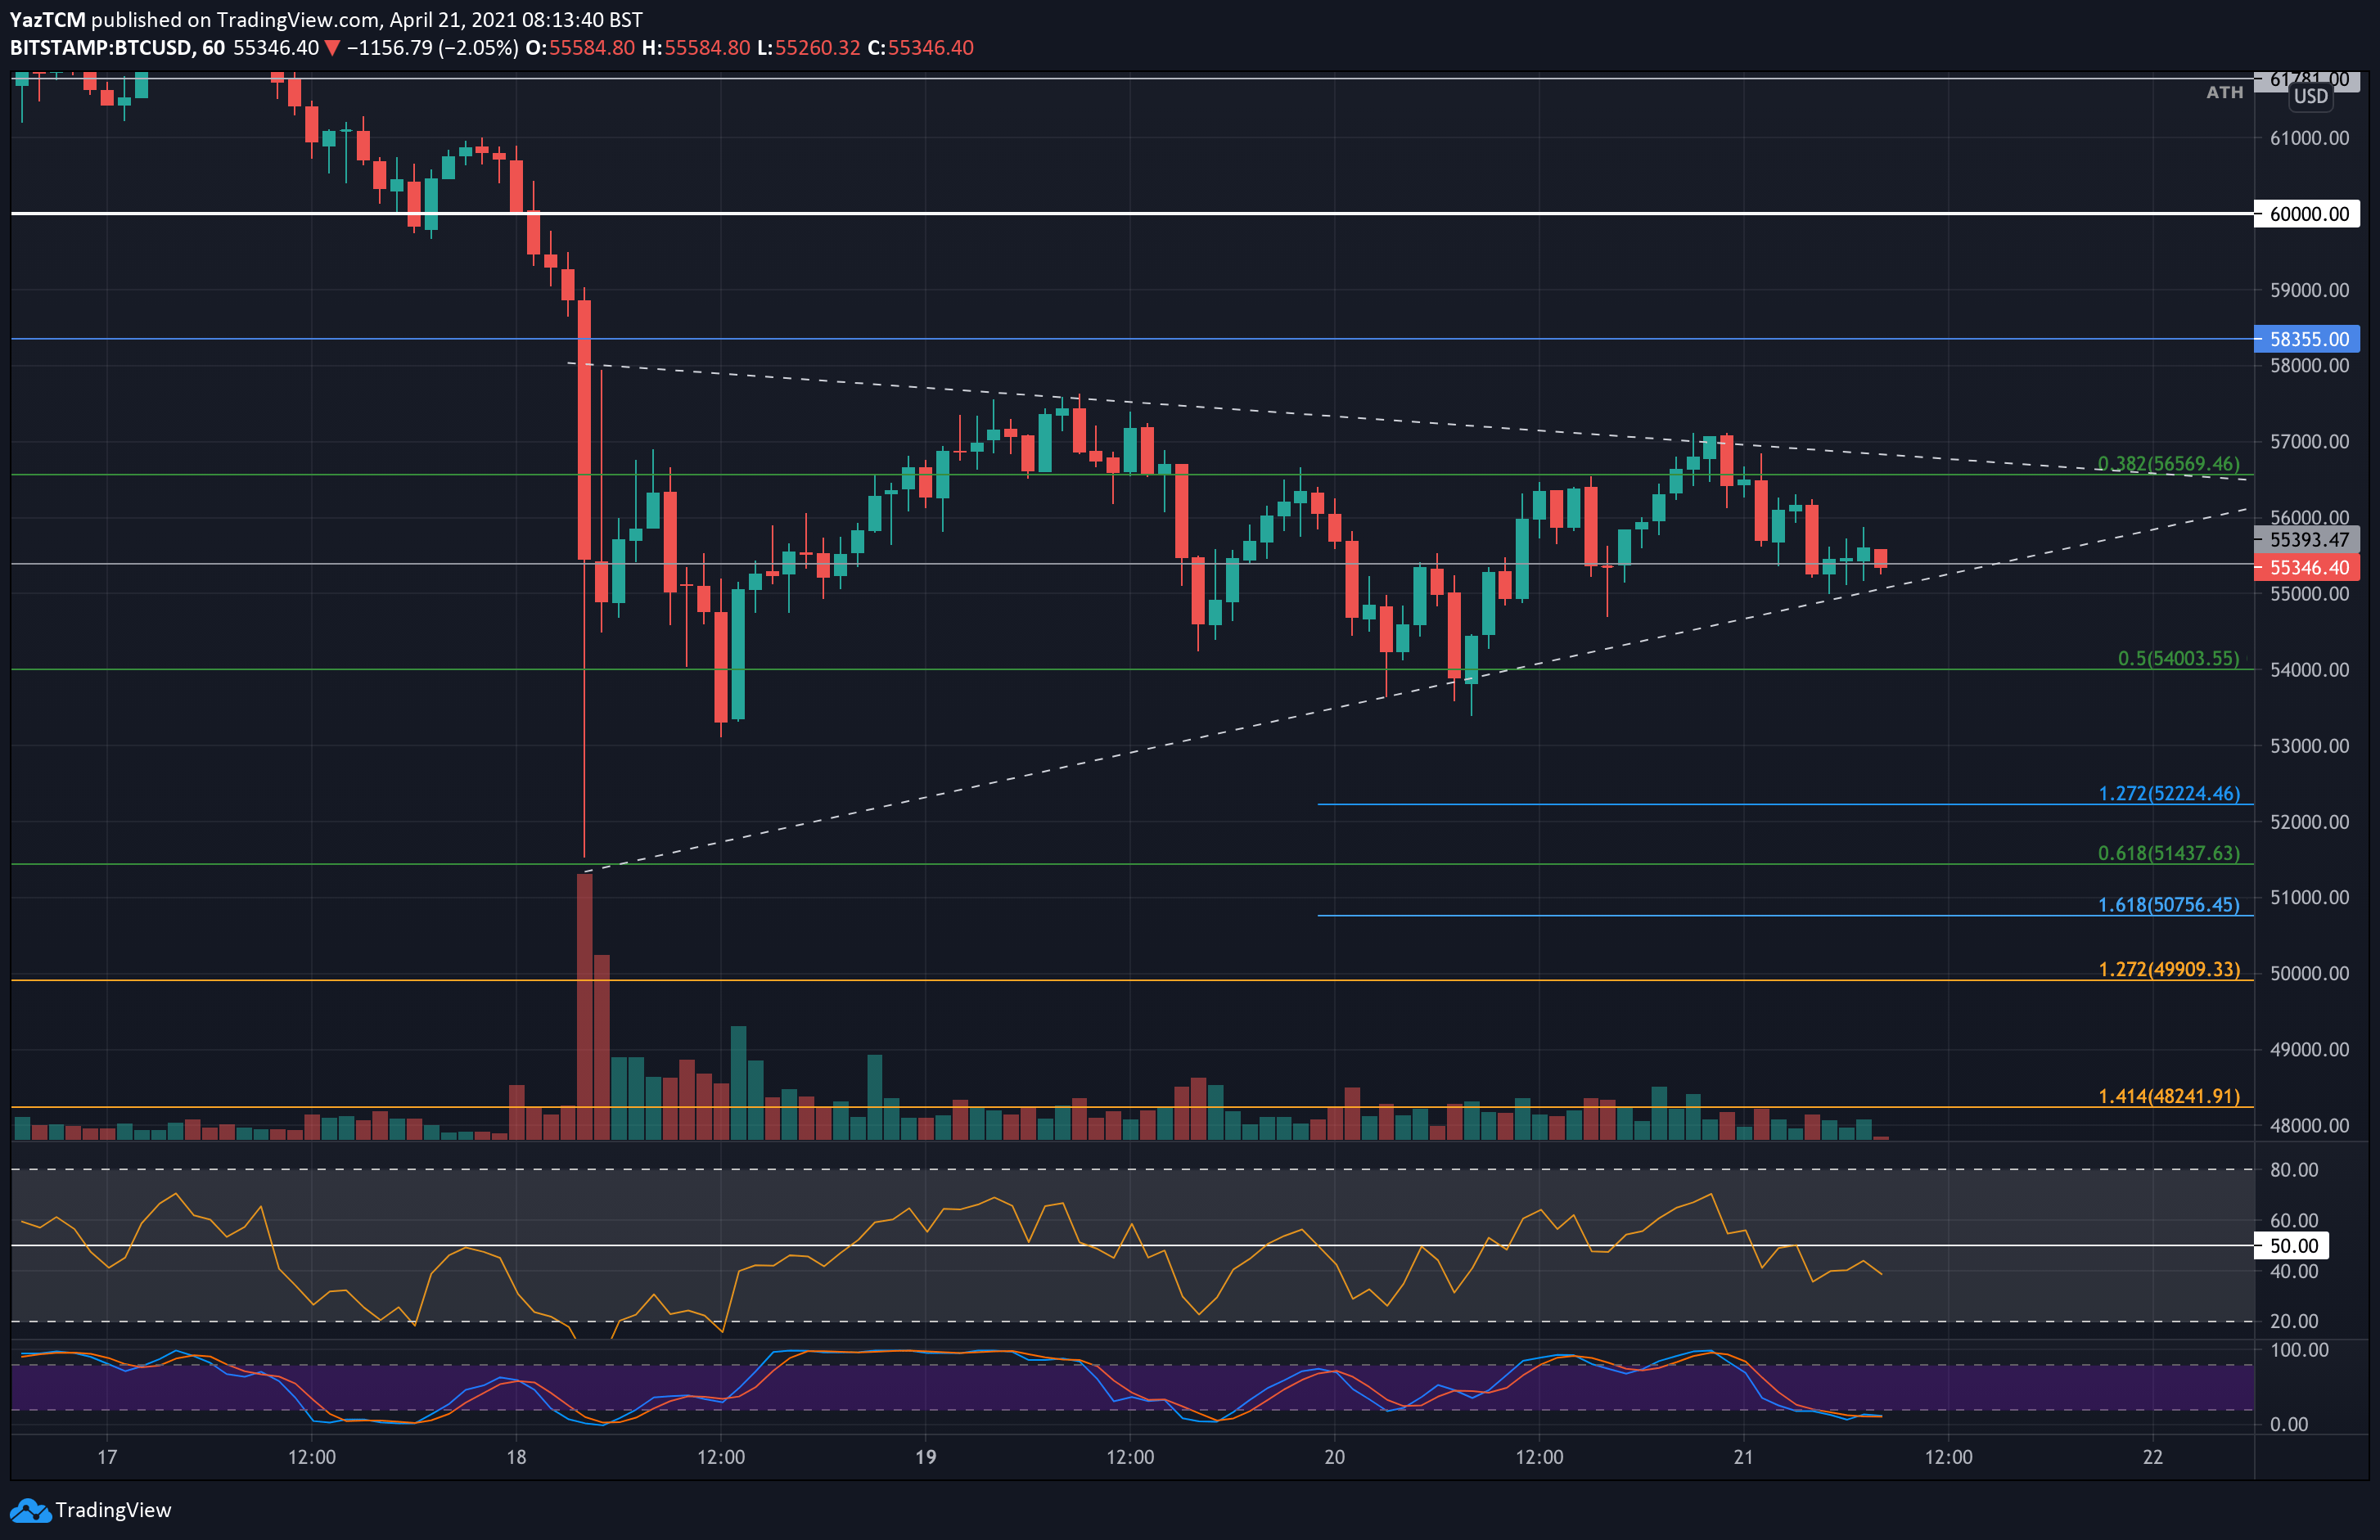
Looking at the smaller time-frames, on the following 1-hour chart, BTC is forming a symmetrical triangle pattern as indecision looms within the market. The breakout of this consolidation phase is likely to dictate the next direction for Bitcoin, with all indicators pointing to a potential break toward the downside.
BTC Price Support and Resistance Levels to Watch
Key Support Levels: $55,000, $54,000, $53,300, $52,225, $51,440.
Key Resistance Levels: $56,780, $57,000, $58,000, $58,355, $58,900.
Looking ahead, the first support lies at $55,000 (lower angle of the triangle together with horizontal support line). Beneath the triangle, support lies at $54,000 (.5 Fib), $53,300 (yesterday’s low), $52,225 (downside 1.272 Fib Extension), and $51,440 (.618 Fib and low form Sunday’s drop).
On the other side, the first resistance lies at the 50-days MA around $56,780 (also the upper angle of the triangle). Above this, resistance lies at $57,000, $58,355, and $58,900 (20-days MA).
As mentioned, the daily RSI is beneath the 40 level, indicating that the bearish momentum is increasing within the market. Additionally, the short-term RSI (1-hour chart) also slipped back beneath the midline, indicating that the bears are still in control of the short-term momentum. Both of these indicators point to a potential breakout toward the downside of the current triangle.
Bitstamp BTC/USD Daily Chart

Bitstamp BTC/USD 1-Hour Chart


