Bitcoin Price Analysis Dec.8: After 10% Short Squeeze The Situation Is Still Bearish
After capturing a new annual low, Bitcoin was consolidating for around 12 hours before reaching to lower areas and marking the $3200 zone as the new yearly low.
This was followed by a new record of the open short positions on Bitfinex. We mentioned it in our yesterday’s article, along with the possibility for a short squeeze.
As anticipated, not long afterward, a nice short squeeze had occurred sending Bitcoin for nice 10% gains, reaching a high of $3530 on Bitstamp (this resistance area include the top of the wedge formation, along with the 50 days moving average line).
As a reminder from yesterday:
“The hourly chart movement reveals a wedge pattern. $3300 is the bottom line of it. In the above correction, I can only assume Bitcoin will meet with the upper line of the wedge around $3500. “
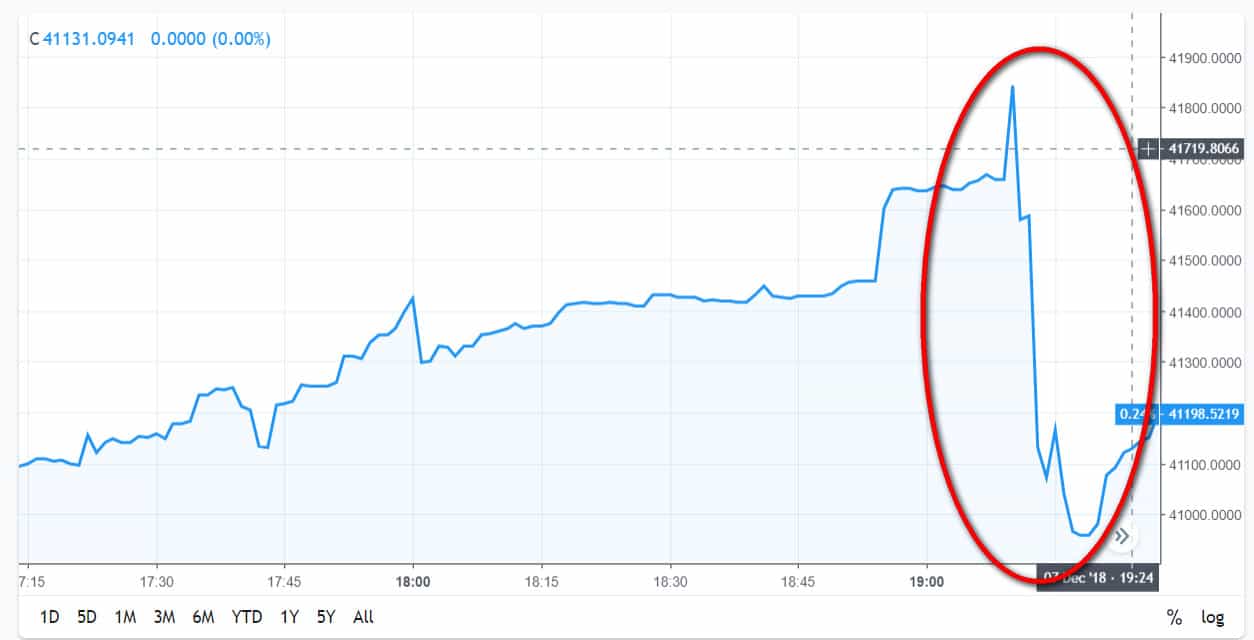
In the following chart, you can get a little idea of an effect of a short squeeze – 2% of the open positions were forced to close in trade for 10% gain in just a couple of minutes. Imagine what will happen when 20% of the positions would get liquidated at once.
Looking at the 1-day & 1-hour charts
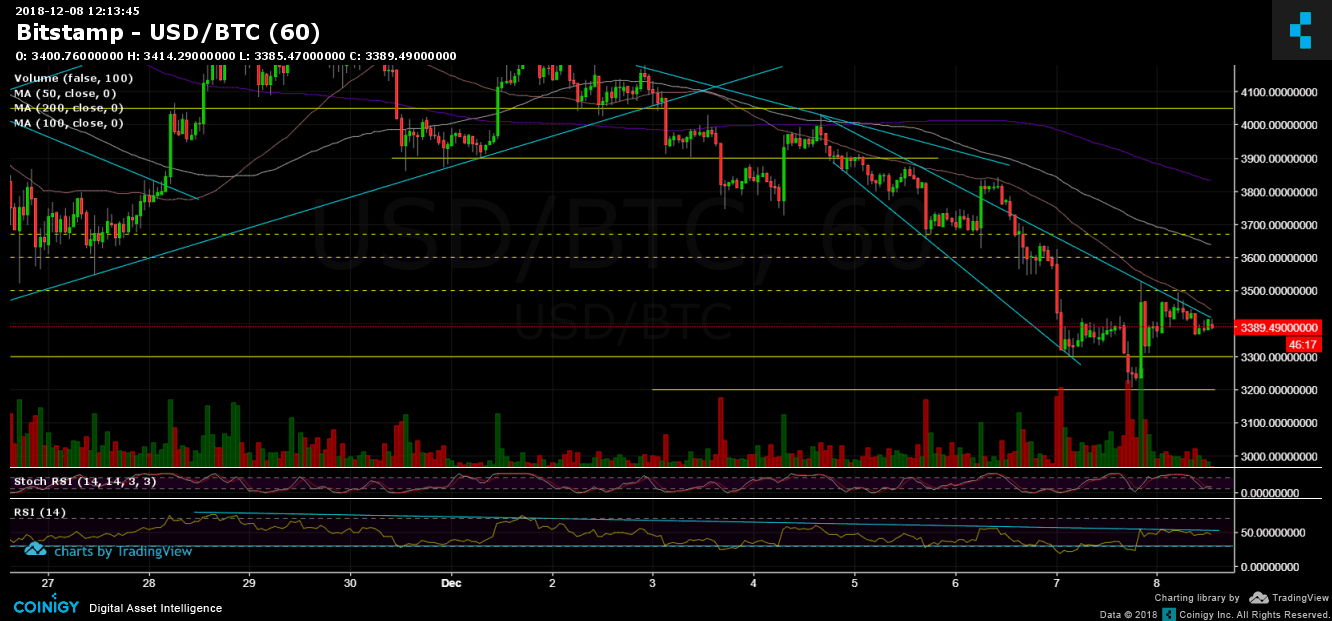
- The short-term’s wedge pattern is still active. During the recent hours, Bitcoin is consolidating underneath the upper trend-line of the wedge, as can be seen on the following 1-hour chart.
- The 1-Hour chart’s RSI: As mentioned before, the RSI is forming a bearish triangle pattern. As of now, the RSI level is at 50, touching the descending trend-line from below, while the base of the triangle is the significant 30 RSI level. Breakout of the triangle is likely to produce a move towards the breakout’s direction.
- Critical support and resistance levels:
From the bull side – 50 days moving average line along with the descending trend-line (of the wedge). $3500, $3600 (resistance level along with 100 days moving average line), $3850 (a strong resistance level, prior high).
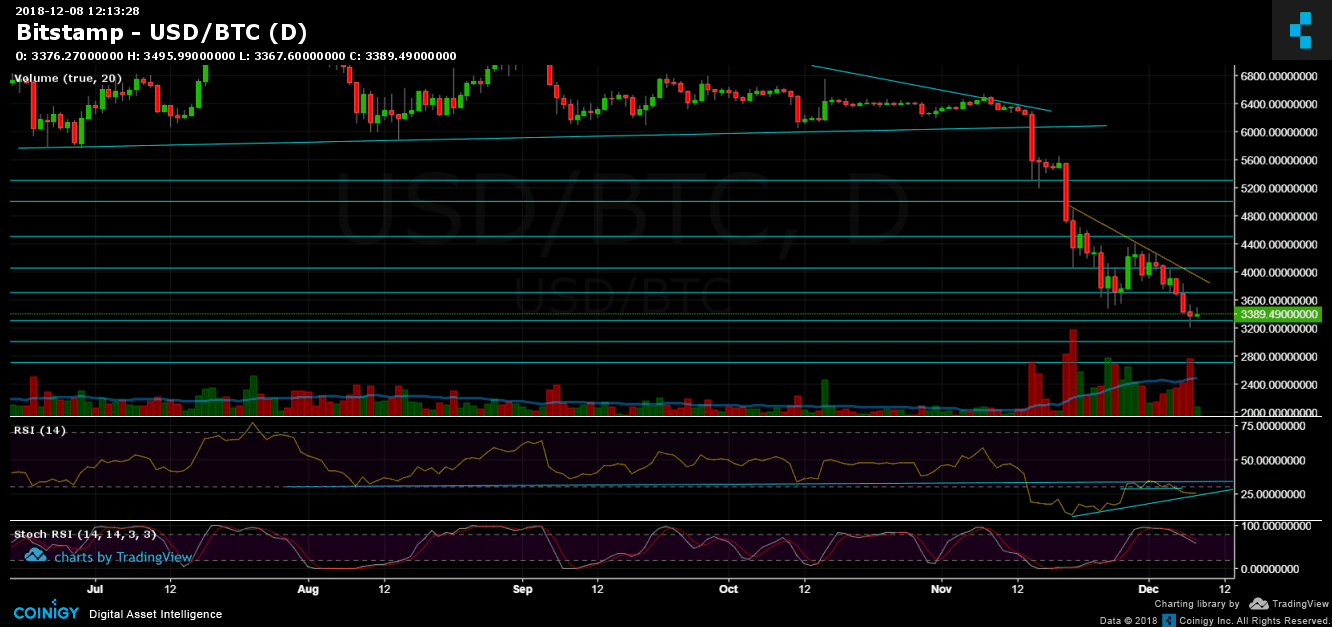
From the bear side: $3300, $3200, $3000, $2900, $2700. - The daily chart RSI: After losing support at 28.5 RSI level, the RSI is nearing the ascending trend-line, where it found support twice before. A third-time reversal might produce a short-term bullish correction.
- As mentioned above, BitFinex’s open short positions have reached a new all-time high, and currently stand around 42,700 BTC of open positions.
BTC/USD BitStamp 1-Hour chart
BTC/USD BitStamp 1-Day chart
Cryptocurrency charts by TradingView. Technical analysis tools by Coinigy.
The post Bitcoin Price Analysis Dec.8: After 10% Short Squeeze The Situation Is Still Bearish appeared first on CryptoPotato.